Packages
BEAM process accounting history in Timeless: VM statistics, series for applications and processes, and an exit record for every process that ends.
Current section
Files
Jump to
Current section
Files
timeless_beam_acct
README.md
README.md
# timeless_beam_acct
**Process accounting history for a running BEAM, in
[Timeless](https://github.com/awksedgreep/timeless-libsql).**
What [timeless-acct](https://github.com/awksedgreep/timeless-acct) is to a
Linux host, this is to a node. `timeless_beam_acct` records six things:
- what **sar** would record of a node: schedulers, run queues, memory,
garbage collection, I/O, tables, connections to other nodes, and how
near the node is to its limits;
- a set of series for every **application**, and for every **group** of
processes that are the same thing, under a name that outlives a restart;
- a set of series for every **process** that someone gave a name, or that
is large;
- an **accounting record for every process that ends**, however briefly it
lived, with what it was and why it ended;
- a **trace for every job**: each request, each task, as the tree of
processes it was;
- what **the VM remarks on**: a garbage collection that took long, a queue
that grew long.
It stores them in Timeless, so they can be put on a
[Timeless canvas](https://github.com/awksedgreep/timeless_canvas) and the
timeline dragged back: what was this node doing, and which process was
doing it, at 03:12 last Tuesday.
And it can be watched where it is, in a terminal, with the same timeline
and the keys of `timeless-acct watch`:
```text
$ mix timeless_beam_acct.watch tba_bench@ohm
┌ timeless-beam-acct tba_bench@ohm ──────────────────────────────────── ● LIVE 2026-09-30 09:55:00 ┐
│run queue 0 schedulers 0.1% (cpu 48.6%) mem 142 MiB │
│work 1.8M reds/s processes 526 (+82.5 -82.3/s) gc 152/s io ↓21 B/s ↑127 KiB/s atoms 2.6% │
│ ▅▄▅▅▆▆▆▆▆▆▇▇▇█▇▇▆▇▇▆▆▅▅▅▄▄▅▄▅▅▆▆▆▅▅│
│ !!!!!!!!!!!!!!!!!!!!!!!!!!!!!!!!!!▲│
└ 08:55 ──────────────────────── schedulers over 1h00m, up to 0.2% ───────────────────────── 09:55 ┘
1 Groups 2 Processes 3 Jobs 4 Exits by work
GROUP WORK% MEMORY PROCS MSGQ REDS/s ENDED/s
fn in Reports.Monthly.run/1 39.5 50.6 KiB 13 0 727k 0.7
Reports.Monthly.run/1 11.7 74.0 KiB 8 0 216k 0.1
TimelessBeamAcct.Writer 8.5 2.2 KiB 1 0 156k 0.0
┌ fn in Reports.Monthly.run/1 work, the 10m00s before ───────────────────────────────── peak 57.5% ┐
│ ▆▆ ▃▄▄ █▄▄▁▁ ▂▁▁ ▁▁▁▂▂ │
│▅██ ▅▃▃▄▂▂ ▂▁▁▃▃ ▂▂▁ ▃▃▅▅ ▄▄███ █████▄ ▃▃ ███▄▅▅█████▂▂ ▅│
│████▃▃ ▃▃▇▇██████ █████▄▅▅███▆▆ ▅▅▅██▃▃▄████▄█████▅▅████████▅▂▂ ██▃ ▃▃█████████████▃▇▇▄█│
│██████▇▇▂█████████████████████████▄▅▅███████████████████████████████▄▄ █████▅▅████████████████████│
└──────────────────────────────────────────────────────────────────────────────────────────────────┘
←→ 10s ,. 1m <> 10m [] 1h t go to l live -+ zoom tab view enter open m its moment s sort / only ? h
```
That is the node of `bench/watch_node.exs`, in which a request in ten
is made to fail: the `!` under the timeline is each of them.
```text
iex> TimelessBeamAcct.top(app: "busy", n: 4)
2026-09-29 18:05:20 busy@ohm (78 processes)
run queue 0 schedulers 0.1% mem 73.9 MiB 1.5M reductions/s
PID APP WORK% REDS/s MEMORY MSGQ AGE PROCESS
<0.124.0> busy 14.8 225k 588 KiB 0 >42.5s Busy.Hoarder
<0.125.0> busy 0.2 3.6k 16.6 KiB 0 >42.5s Busy.Requests
<0.126.0> busy 0.2 2.4k 11.5 KiB 0 >42.5s Busy.Traffic
<0.123.0> busy 0.1 1.0k 24.1 KiB 0 >42.5s Busy.Cache
iex> TimelessBeamAcct.exits(failed: true)
ENDED PID APP STATUS ELAPSED REDS PEAK MEM PROCESS
2026-09-29 18:05:17 <0.9148.0> busy timeout 265µs - - Busy.Request.handle/1
2026-09-29 18:05:19 <0.9487.0> busy RuntimeError 344µs - - Busy.Request.handle/1
```
Those two lived for a third of a millisecond. No sampler saw them; the VM
reported them. And this is one request, as the VM saw it:
```text
iex> TimelessBeamAcct.trees(failed: true, limit: 1)
2026-09-29 18:05:19 4 processes over 261µs, 1 failed in busy (trace b84c7c8de0507087c20a35184ea0e8ed)
Busy.Request.handle/1 261µs [exited timeout]
├─ fn in Busy.Request.handle/1 52µs
├─ fn in Busy.Request.handle/1 98µs
└─ fn in Busy.Request.handle/1 113µs
```
## Status
Version 0.3.2. Collection, the sinks, putting a collector into a running
node, the three views, recordings, `watch`, and the page in LiveDashboard
work and are tested against a live VM, on OTP 27, 28 and 29, and on
OTP 26 without exit accounting.
[What is not here yet](#what-is-not-here-yet) is listed at the end, and
[DESIGN.md](DESIGN.md) explains the decisions.
Elixir 1.18 or later, on OTP 26 or later. Exit accounting needs OTP 27 or
later, and what the VM remarks on needs OTP 28 or later; on an older VM
the collector runs without them. A collector has no dependencies when it runs. Igniter is an
optional one, for the installer.
## Quick start
### In an application
With [Igniter](https://hexdocs.pm/igniter):
```sh
mix igniter.install timeless_beam_acct
```
It adds the page of recordings to the application's LiveDashboard, with
where the planes are for it, and nothing else: no collector is
configured, and nothing is collected until a recording is started, from
the page, with `mix timeless_beam_acct.record`, or with `stop_after:` in
code. A recording ends by itself. `--metrics-url`, `--logs-url`, and
`--traces-url` say where the planes are.
A collector that starts with the application and runs until it is
stopped is asked for, and never assumed:
```sh
mix igniter.install timeless_beam_acct --always-on
mix igniter.install timeless_beam_acct --always-on --sink timeless
```
That configures one to start with the application, and to stay off
while the application's tests run. `--sink` is `http` (the default),
`timeless`, or `stdout`. With `--sink timeless` the collector is put
among the application's children instead, after the stores it writes
to, and runs while the tests run as they do:
[To the stores in the node](#to-the-stores-in-the-node) has what was
found of that. A collector left running is not light on the planes
(DESIGN.md, "How many series that is, over time"); a recording is the
way it is meant to be run.
`mix igniter.install` brings Igniter for as long as it runs. With the
package among the dependencies already, `mix timeless_beam_acct.install`
does the same, and needs Igniter among them too:
`{:igniter, "~> 0.6", only: [:dev, :test], runtime: false}`.
Or by hand:
```elixir
# mix.exs
{:timeless_beam_acct, "~> 0.3"}
```
```elixir
# among the children of a supervisor
{TimelessBeamAcct, sink: :http}
```
or, with no change to the application's code:
```elixir
# config/runtime.exs
config :timeless_beam_acct, start: true, sink: :http
```
Nothing is collected unless one of the two is there. A collector asks the
VM for word of every process that starts and ends, and that is not
something to begin doing to a node because a package was added to it.
Then, from a shell on the node:
```elixir
iex> TimelessBeamAcct.check()
```
`check` reports what this node lets a collector see, and what to do about
what it does not:
```text
trace sessions available
word of each exit heard: 8089 started and 8091 ended so far
what the VM remarks on heard
process iterator available
one key of a dictionary available
scheduler wall time on
microstate accounting not asked for
processes 78 of 1048576
collector running: a sweep of 75 processes took 2ms, every 10.0s; 47 have series of their own
sink http: http://127.0.0.1:8428/api/v1/import/prometheus, ...
written 6 ticks, 0 failed
metrics plane http://127.0.0.1:8428 answering: timeless-metrics-api 0.8.5
logs plane http://127.0.0.1:9428 answering: timeless-logs-api 0.8.5
traces plane http://127.0.0.1:10428 answering: timeless-traces-api 0.8.5
```
### Turning it off
A collector that was started with the application:
```elixir
config :timeless_beam_acct, start: false
```
or now, in a node that is running, without a restart:
```elixir
iex> TimelessBeamAcct.stop()
```
which stays stopped until the application is started again. A collector
that is among the children of a supervisor is that supervisor's to stop.
A collector that was put into a node:
```sh
mix timeless_beam_acct.detach app@ohm --cookie secret
```
Either way what ended since the last sweep is accounted, what the sink
has waiting is sent, and the VM is left as it was found: the trace
session is ended, and the statistics the collector turned on are turned
off. If the collector's processes are killed instead, the session ends
with them.
### In a node that is already running
The node that needs accounting for is the one that is misbehaving now and
was built last month without a collector in it. One can be put in from a
terminal:
```sh
mix timeless_beam_acct.check app@ohm --cookie secret
mix timeless_beam_acct.attach app@ohm --cookie secret --sink http
mix timeless_beam_acct.top app@ohm --cookie secret
mix timeless_beam_acct.exits app@ohm --cookie secret --since -15m --failed
mix timeless_beam_acct.trees app@ohm --cookie secret --failed
mix timeless_beam_acct.detach app@ohm --cookie secret
```
Nothing is installed in the node and nothing is restarted: the collector's
modules are sent to it and loaded, and detaching takes them out again. The
collector stays when the task that attached it ends.
The node has to have Elixir in it, no older than the Elixir and the OTP
the task runs on. `examples/busy_node.exs` is a node to try it on.
### For a while: a recording
A collector is something run while something is looked for, and stopped.
Left running for days, its series of processes pile up in the planes
(DESIGN.md, "How many series that is, over time"). So the way to run one
is as a **recording**, which ends by itself:
```sh
mix timeless_beam_acct.record app@ohm --cookie secret --for 1h --sink http
mix timeless_beam_acct.record app@ohm --start-at 01:55 --for 90m
mix timeless_beam_acct.record app@ohm --extend 30m
mix timeless_beam_acct.record app@ohm --stop
mix timeless_beam_acct.recordings --logs-url http://127.0.0.1:9428
mix timeless_beam_acct.watch --recording bfca9934 --metrics-url ... --logs-url ... --traces-url ...
```
or in code, `stop_after: "1h"` among a collector's options. A recording
runs an hour unless told, and a day at most unless `:max_recording` says
more. Its timer is in the node: it ends when it is to whether or not
anyone is still there to stop it, flushing what it has as a stopped
collector does. A recording among the children of a supervisor is not
started again when it ends.
`--start-at` (`start_at:`) begins it later, in the node's own local
time: a job that runs at two for an hour is recorded from five to two
for ninety minutes, and not from bedtime for eight hours. A time of day
that has passed today is that time tomorrow, and `+30m` is half an hour
from now. Until then the collector waits and reads nothing.
It writes a record when it begins and one when it ends, `kind`
`recording`, beside the records of processes. That is what
`recordings` lists, and what `watch --recording` opens: the node it was
of, at its end, with the timeline long enough to have all of it.
### In LiveDashboard
An application with Phoenix LiveDashboard has a page of recordings: the
one running in the node chosen at the top of the dashboard, with how far
along it is, **Stop**, and **+1 hour**; and the recordings the logs plane
has, with how each ended.
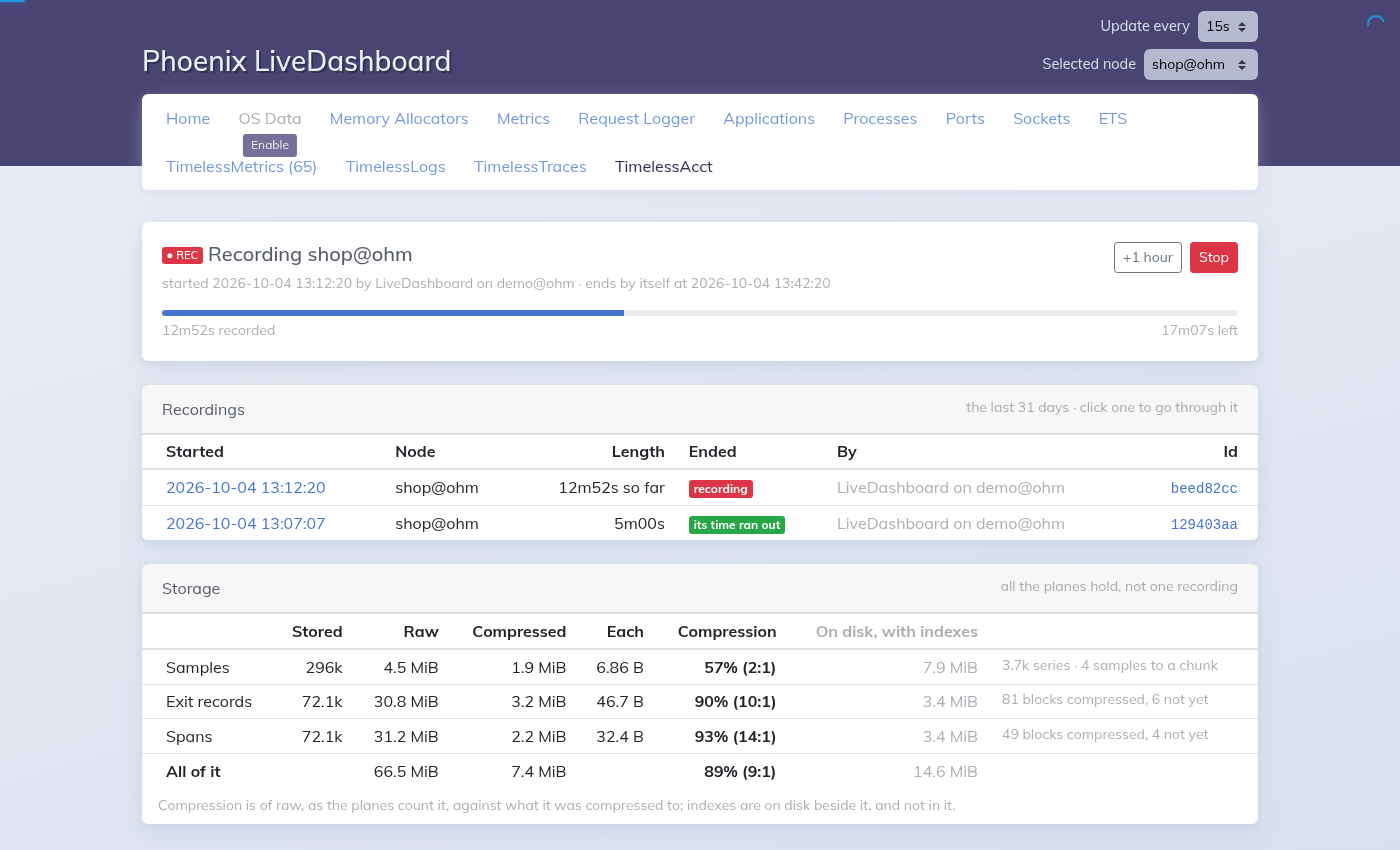
A node being recorded: started from this dashboard, in another node,
and to end by itself at 13:42. Under it the recordings, and what the
planes hold and how small: exit records and spans at 10:1 and 16:1, the
indexes beside them on disk and not in the figure.
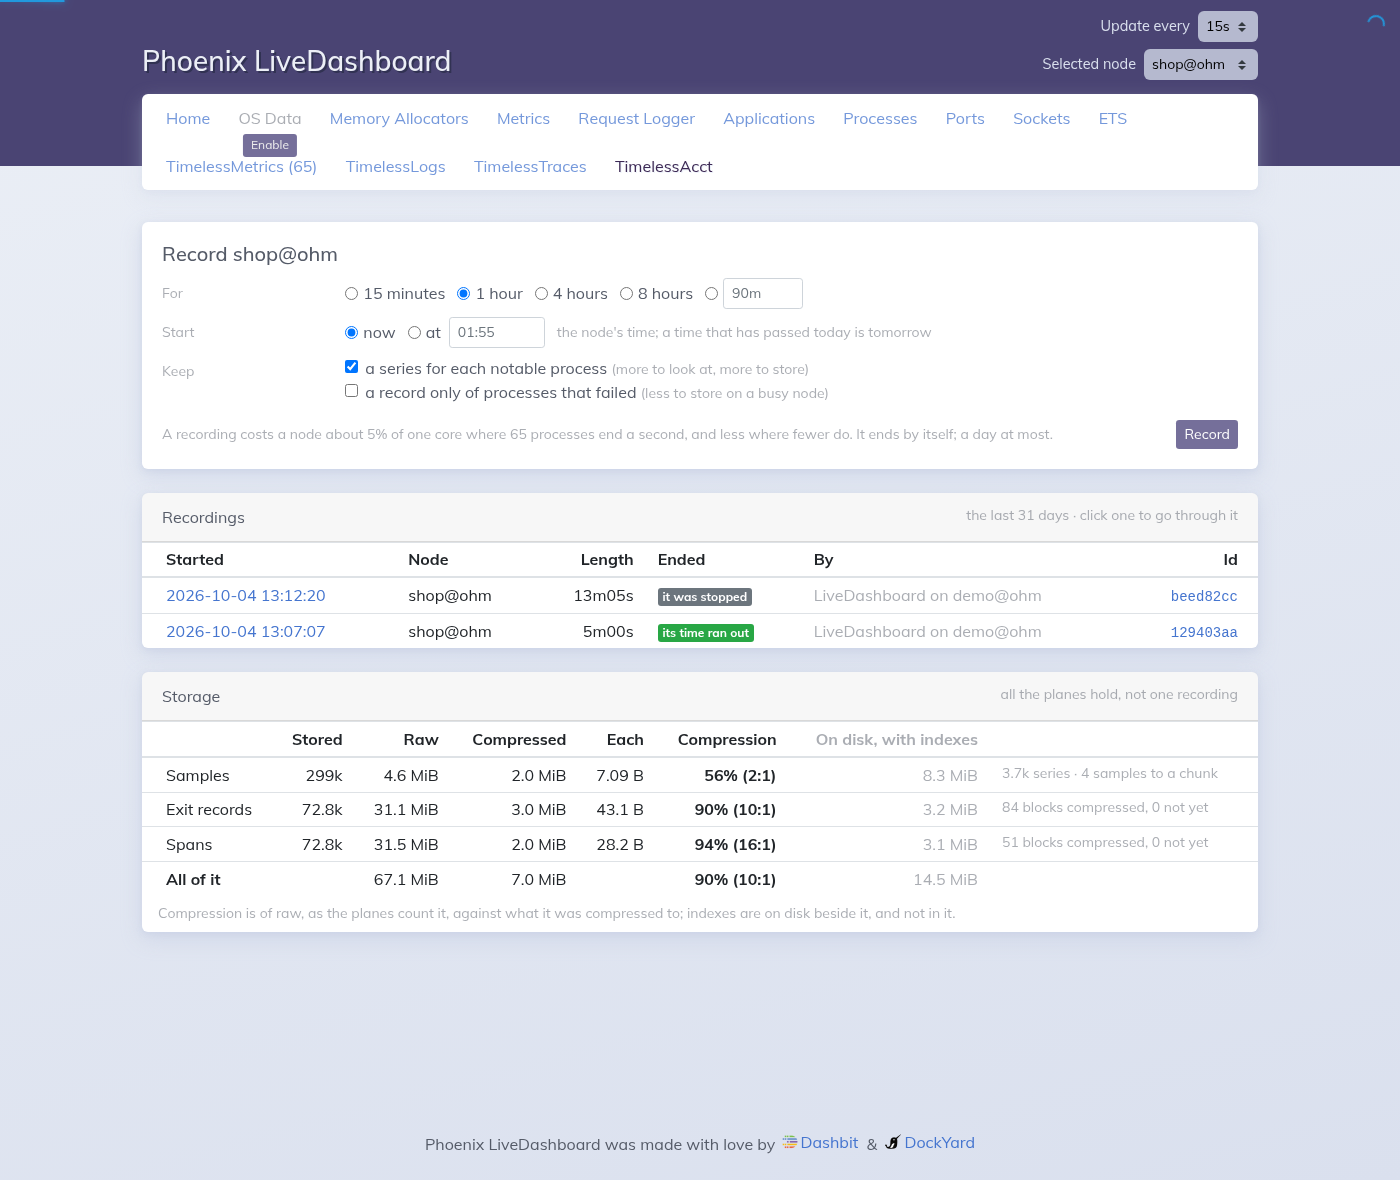
With none running, the form: for how long, now or at a time of the
node's, and what to keep. A recording ends by itself, a day at most.
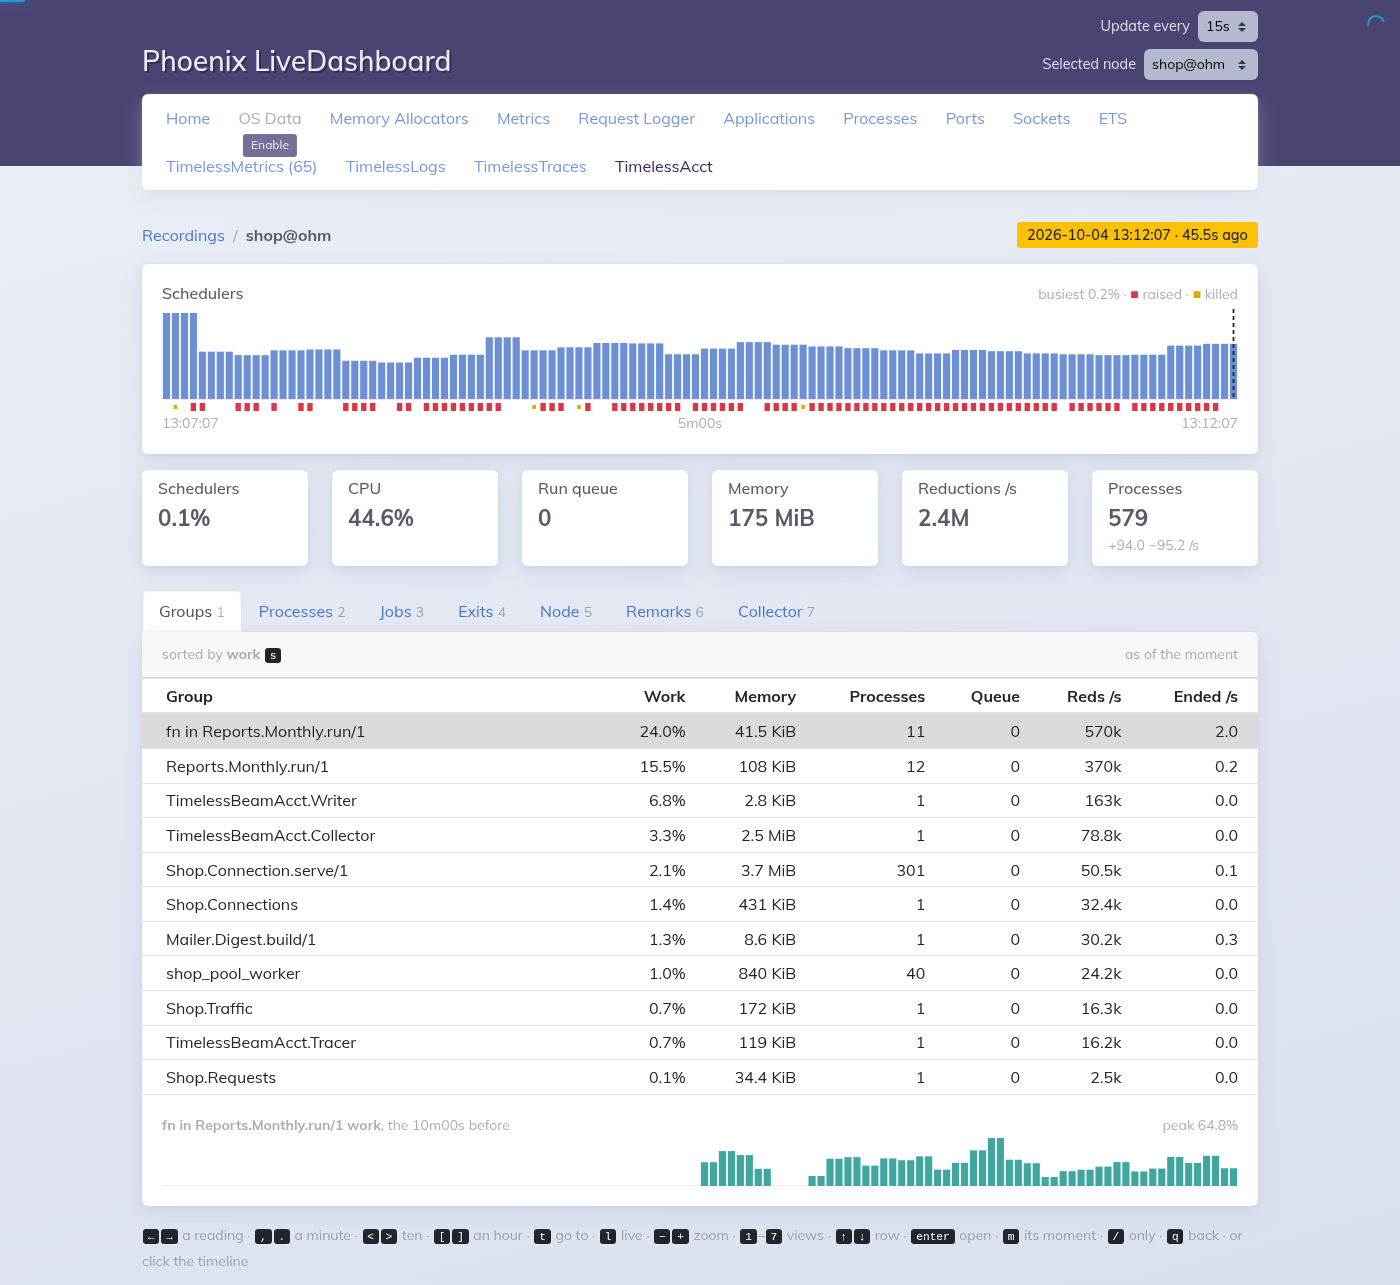
A recording opened, at its end: the timeline across the top, red where a
process raised and yellow where one was killed, and the groups as of the
moment, with how one of them worked over the ten minutes before. The
keys are `watch`'s. Schedulers is the work of the schedulers, over all
twenty-two of them; CPU is what the OS gave the node, which counts the
time a scheduler spins waiting for work, and on a node of many short
processes is far the larger.
The page is compiled only in an application that has
`phoenix_live_dashboard`: it and `phoenix_live_view` are optional
dependencies of this one, and an application without them fetches
neither. The application needs no collector of its own for the page: a
recording started from the page starts one, and it is gone when the
recording ends.
#### Adding the page
```elixir
# mix.exs
{:timeless_beam_acct, "~> 0.3"}
```
Then one of three, in the router.
**Beside the dashboard the application has already.** An application
made by `mix phx.new` has one, at `/dev/dashboard`; the page is one more
of its pages:
```elixir
live_dashboard "/dashboard",
metrics: MyAppWeb.Telemetry,
additional_pages: [beam: TimelessBeamAcct.Dashboard.Page]
```
**A dashboard of its own**, with the page in it, in one line:
```elixir
import TimelessBeamAcct.Dashboard.Router
scope "/" do
pipe_through :browser
timeless_beam_acct_dashboard "/beam"
end
```
**A dashboard of its own, with LiveDashboard's options.** What is
given as `:live_dashboard` is given to `live_dashboard`: the
application's metrics, `on_mount` (in [Securing it](#securing-it)),
`csp_nonce_assign_key`, and the rest:
```elixir
timeless_beam_acct_dashboard "/beam",
live_dashboard: [metrics: MyAppWeb.Telemetry, ecto_repos: [MyApp.Repo]]
```
The page is under `beam` in each: `/dashboard/beam`, `/beam/beam`.
**By the installer.** `mix timeless_beam_acct.install` (or `mix
igniter.install timeless_beam_acct`), which starts no collector, adds the page to the
`live_dashboard` in the router, the one `mix phx.new` makes among them,
and says where the planes are in `config.exs`. Run again, it adds
nothing more. A dashboard whose `additional_pages` are not written out
as a list, `additional_pages: pages()`, is left as it is, and the
installer says what to add.
**With timeless_phoenix.** An application that has both packages,
timeless_phoenix 2.0.4 or later and this one, has the page on
timeless_phoenix's dashboard: `TimelessPhoenix.dashboard_pages/1` adds
it when this package is among the application's dependencies.
timeless_phoenix does not depend on this package and does not install
it: an application with timeless_phoenix alone has its three pages and
no more, and nothing of this one. Each is installed by its own
installer. Nothing is added to the router, and it does not matter which
of the two installers runs first:
timeless_phoenix's takes out the `live_dashboard` that `mix phx.new`
made, and the page with it, and puts its own dashboard, with the page,
in its place. Both orders were run against a new `mix phx.new`
application, and the page was in the menu of each.
#### Where the planes are
The page lists recordings and reads them from the planes, and a
recording it starts writes to them. It is told where they are in the
configuration, which is read when the page is, so `runtime.exs` will
do:
```elixir
# config/runtime.exs
config :timeless_beam_acct, :dashboard,
metrics_url: System.get_env("TIMELESS_METRICS_URL", "http://127.0.0.1:8428"),
logs_url: System.get_env("TIMELESS_LOGS_URL", "http://127.0.0.1:9428"),
traces_url: System.get_env("TIMELESS_TRACES_URL", "http://127.0.0.1:10428"),
# for planes started with TIMELESS_AUTH_MODE=required; or one each,
# as metrics_token:, logs_token:, traces_token:
token: System.get_env("TIMELESS_TOKEN")
```
Without `:dashboard` configured the page says so, and lists nothing.
#### Securing it
What someone who can open the page can do:
- **Record any node the dashboard can choose**, which is every node
connected to this one: start a recording of up to a day, make one
longer, and stop one. A recording asks the VM for word of every process
that starts and ends, and costs the node a little of a core while it
runs ([Cost](#cost)).
- **Read what was recorded**: process and group names, registered names,
applications, and how each process ended, the reason written out. A
reason can carry what a process had in hand when it failed: the value
of a `badmatch`, say.
The page has no switch of its own that makes it read-only; who can reach
it is the router's to say, as it is for the rest of LiveDashboard,
which can kill processes. The ways, from least to most:
**Only while developing.** `mix phx.new` puts the dashboard in a scope
that is compiled only in dev, which is where the page is safest:
```elixir
if Application.compile_env(:my_app, :dev_routes) do
import Phoenix.LiveDashboard.Router
scope "/dev" do
pipe_through :browser
live_dashboard "/dashboard",
metrics: MyAppWeb.Telemetry,
additional_pages: [beam: TimelessBeamAcct.Dashboard.Page]
end
end
```
**In production, behind a password.** A pipeline with HTTP basic auth,
the password from the environment, in its own scope, out of the dev
one:
```elixir
pipeline :admins_only do
plug :admin_basic_auth
end
scope "/admin" do
pipe_through [:browser, :admins_only]
timeless_beam_acct_dashboard "/beam"
end
defp admin_basic_auth(conn, _opts) do
Plug.BasicAuth.basic_auth(conn,
username: System.fetch_env!("ADMIN_USER"),
password: System.fetch_env!("ADMIN_PASSWORD")
)
end
```
Only over HTTPS: basic auth sends the password with every request.
**In production, behind the application's own users.** An application
with `mix phx.gen.auth` has a plug for the request and a hook for the
LiveView; both are needed, the plug for the first page and the hook for
the socket after it. A role or a list of who may is the application's
to check, in a hook of its own:
```elixir
scope "/admin" do
pipe_through [:browser, :require_authenticated_user]
timeless_beam_acct_dashboard "/beam",
live_dashboard: [on_mount: [{MyAppWeb.UserAuth, :require_admin}]]
end
```
Then, whichever of these:
- **A shorter longest recording.** A day is the most unless the
application says less, and what it says is what the page holds to, for
a recording it starts and for one it makes longer, in whichever node:
```elixir
# config/runtime.exs
config :timeless_beam_acct, max_recording: "4h"
```
- **Planes that ask for a token.** Planes started with
`TIMELESS_AUTH_MODE=required` answer only a request with a token,
which the page is given as above, and a recording it starts is given
in turn. A collector configured outside the page is given its own
(`token:` among its options).
- **The nodes it can reach.** The nodes the page can record are those
connected to the one it runs in: what the cookie lets in. A node that
should not be recorded from this dashboard is one it does not connect
to.
A recording is started from the page too: how long, now or at a time,
and what of it to keep. And a recording is opened from the list, as
`watch` opens one: the timeline of it across the top, to click on, and
the groups, processes, jobs, and exits as of the moment picked, with
`watch`'s keys; and three views a page has room for that a terminal has
not, `5` to `7`: the node over the whole timeline, a figure to a line,
what the VM remarked on, and what the collector said of itself. Under
the list of recordings, what the planes hold and how small: samples,
records, and spans, raw, compressed, and with their indexes. What is
read and what a key does are `watch`'s own, so
the two do not come to differ. The link has the recording in it, and
can be sent to someone.
### To the canvas
The canvas reads from the Timeless planes. Point the collector at them:
```elixir
{TimelessBeamAcct,
sink: :http,
metrics_url: "http://127.0.0.1:8428",
logs_url: "http://127.0.0.1:9428",
traces_url: "http://127.0.0.1:10428"}
```
Then, on a canvas, an element for an application is:
| field | value |
|---|---|
| host | `ohm` |
| metric | `beam_app_memory_bytes` |
| series label | `app` = `my_app` |
for everything that is one kind of thing:
| field | value |
|---|---|
| host | `ohm` |
| metric | `beam_group_reductions_per_sec` |
| series label | `group` = `MyApp.Worker` |
and for one process:
| field | value |
|---|---|
| host | `ohm` |
| metric | `beam_proc_memory_bytes` |
| series label | `proc` = `MyApp.Repo<0.512.0>` |
An application and a group are the same line after a restart. A process is
a new one, because it is a new process. The timeline scrubber does the
rest.
A host element turns red when a process on the host crashes, and amber
when one is killed; see
[the level of a record](DESIGN.md#the-level-is-a-judgement-about-the-host).
Every series carries `host` and `node`. `host` is the host's name, so that
a node's lines are beside those timeless-acct records of the host it runs
on, and the host's element takes its colour from the node's records too.
Where a host runs more than one node, an element chooses by `node` as
well:
| field | value |
|---|---|
| host | `ohm` |
| metric | `beam_app_memory_bytes` |
| series label | `app` = `my_app` |
| `node` | `app@ohm` |
Every field of an element that does not configure it is a label it
chooses by, so `node` is one more. Choosing a series from the list in the
properties panel writes all of its labels, `node` among them. With `node`
set to a canvas variable, `$node`, one canvas shows whichever node the
variable names.
### Reading with PromQL
PromQL takes, for each series, the last sample in a window before the
moment asked about: five minutes, unless it is told otherwise. A process
that ended writes no more samples, so with five minutes it is counted for
five minutes after it ended. And a process that is alive is not there at
all if the window is shorter than the time between two sweeps.
So ask with a window of about three times the sweep interval:
| reading | is told by |
|---|---|
| the planes | `lookback_delta=30s` on the request |
| `timeless_metrics` in the node | `config :timeless_metrics, promql_lookback_seconds: 30` |
The interval is `:process_interval`, ten seconds unless told, and longer
while sweeps are taking more than `:sweep_budget` allows. What it is at
any moment is `beam_acct_sweep_interval_seconds`.
This matters to whatever adds up or ranks `beam_proc_*`: a sum over a
group's processes, a `topk`. The other tiers say so themselves when a
name has nothing: an application, a group, or a table that has emptied
is reported as nothing, and a peer that has gone is reported once more,
as nothing. Their last samples are true whatever the window.
### To the stores in the node
An application that already has the Timeless stores in it, through
[timeless_phoenix](https://github.com/awksedgreep/timeless_phoenix) or on
its own, can be accounted into them, with no server and no network:
```elixir
{TimelessBeamAcct, sink: {:timeless, metrics: :tp_default_timeless}}
```
What is stored is what the planes would have stored of the same tick:
the same names, the same labels, the same keys.
With this sink a collector is one of the application's own children, and
comes after the stores among them:
```elixir
children = [
{TimelessPhoenix, data_dir: "priv/observability"},
{TimelessBeamAcct, sink: :timeless}
]
```
The stores have to be running when the collector starts, and a collector
started by `start: true` in the configuration starts before any child of
the application does. `mix igniter.install --sink timeless` puts it among
the children, last. `timeless_phoenix`'s installer puts
`{TimelessPhoenix, ...}` first, so the order is right whichever is
installed first. If the collector comes before the stores the
application does not start, and the error says that no store was found
running.
The metrics store has a name, and the one written to unless another is
named is `:tp_default_timeless`. That is the store of `timeless_phoenix`
as its installer leaves it: it names its store `:tp_<name>_timeless`
after the `:name` it is given, and `:default` is the name it has when it
is given none. An application that gave it one says so to the collector:
```elixir
children = [
{TimelessPhoenix, name: :obs, data_dir: "priv/observability"},
{TimelessBeamAcct, sink: {:timeless, metrics: :tp_obs_timeless}}
]
```
Without that the application does not start, and the error names the
store that is running and says what to write:
```text
metrics: no store named :tp_default_timeless is running in this node. The
store that is running is :tp_obs_timeless: it is written to with sink:
{:timeless, metrics: :tp_obs_timeless}. ...
```
The logs and traces stores are one to a node and have no name.
A child of the application is started wherever the application is, its
tests among the rest. A collector that the configuration says is not to
start does not, though it is among the children:
```elixir
# config/test.exs
config :timeless_beam_acct, start: false
```
The installer writes that. Without it a collector runs with the tests,
as the stores do: it reads every ten seconds, so a suite that is over
sooner leaves nothing, and a longer one leaves a record and a span for
each process that ended in it, up to `:max_records` a reading.
The stores are called from a process that is not the writer, so that
what happens to a call does not happen to the collector. It is one
process, kept from one reading to the next, and is accounted in the
group `TimelessBeamAcct.Sink.Timeless.store_calls`.
This was run with `timeless_phoenix` 2.0.3 in an application made by
`mix phx.new` 1.8.15: both installers, a collector writing to the three
stores and read back from them, the application's tests, and the pages
`timeless_phoenix` adds to LiveDashboard.
There is nothing kept for a store that is not running: it is in the same
node, and what it would come back to is gone with it. What could not be
stored is counted, and the other two signals are stored all the same.
The older engines of `timeless_logs` and `timeless_traces` (`engine:
:elixir`) read a record of level `notice` as `info` once it has been
compacted. The libSQL engines keep it.
## What the VM lets a collector see
OTP 26 is the oldest a collector has been run on. Each release after it
adds something:
| OTP | adds |
|---|---|
| 26 | VM statistics; applications; groups; processes that live to a sweep; the parent of each |
| 26.2 | one key of a process's dictionary asked for, and not the whole of it |
| 27 | trace sessions: word of each process that starts and ends, without taking the tracer from whoever has it |
| 28 | what the VM remarks on, without taking the system monitor from whoever has it; the processes read one at a time, and not listed first |
Without trace sessions, a process that was there at one sweep and gone at
the next gets a record marked `source: "sampled"`, with the figures of the
last sweep that saw it and a status of `unknown`. Processes shorter than a
sweep are not seen, and no spans are kept.
On OTP 27 a trace session has no system monitor of its own, and the
node's one is not taken in its place: every exit is accounted, and
nothing the VM remarks on is recorded. `:descriptions`, `:traces` and
`:anomalies` are without effect on a VM that cannot do what they ask, and
`check` says which it cannot.
## What is recorded
Every metric is a gauge, with the rate already taken: the canvas draws the
last value in a bucket, and sar has always recorded rates. Every series
carries `host` and `node`.
Work is counted in **reductions**, which is what the VM counts it in: a
reduction is about a function call, and a scheduler that does nothing else
does something like a hundred million a second.
### The node: `beam_vm_*`
| what | metrics | label |
|---|---|---|
| schedulers | `beam_vm_scheduler_util_pct` | `scheduler` = `all`, `1`, `2`, … |
| | `beam_vm_dirty_cpu_util_pct`, `beam_vm_dirty_io_util_pct` | |
| | `beam_vm_cpu_pct` | |
| run queues | `beam_vm_run_queue`, `beam_vm_run_queue_dirty_cpu`, `beam_vm_run_queue_dirty_io` | |
| work | `beam_vm_reductions_per_sec`, `beam_vm_context_switches_per_sec` | |
| processes | `beam_vm_spawns_per_sec`, `beam_vm_exits_per_sec` | |
| garbage | `beam_vm_gcs_per_sec`, `beam_vm_gc_reclaimed_bytes_per_sec` | |
| I/O | `beam_vm_io_in_bytes_per_sec`, `beam_vm_io_out_bytes_per_sec` | |
| memory | `beam_vm_mem_{total,processes,processes_used,system,atom,atom_used,binary,code,ets}_bytes` | |
| | `beam_vm_persistent_terms`, `beam_vm_persistent_term_bytes` | |
| limits | `beam_vm_processes`, `beam_vm_ports`, `beam_vm_atoms`, `beam_vm_ets_tables`, and each as `_pct` of its limit | |
| threads | `beam_vm_msacc_{emulator,gc,port,check_io,aux,sleep,other}_pct`, with `msacc: true` | |
| | `beam_vm_uptime_seconds` | |
`beam_vm_scheduler_util_pct` is the share of its time a scheduler was
busy, 0 to 100. `beam_vm_cpu_pct` is the CPU the node used as a share of
**one** CPU, as top reports it: a node with four busy schedulers is at
400.
### Tables: `beam_ets_*`
The memory of a table belongs to no process's heap, so it is accounted
here. Label: `table`, the table's name.
`beam_ets_memory_bytes`, `beam_ets_objects`, `beam_ets_tables`.
Tables of one name are added together, and `beam_ets_tables` says how
many there were. The `:max_tables` largest names are reported, and the
rest together as `other`, by the rule that groups are: a name that has a
place is reported at every reading, as nothing while there is no table of
that name.
### Other nodes: `beam_dist_*`
`beam_dist_nodes`, and for each connection, under `peer`:
`beam_dist_in_bytes_per_sec`, `beam_dist_out_bytes_per_sec`,
`beam_dist_queue_bytes`. A peer that has gone is reported once more, as
nothing.
### Applications: `beam_app_*`, and groups: `beam_group_*`
Over **every** process, including those too young or too brief for series
of their own. Label: `app`, or `group`.
| metric | is |
|---|---|
| `_processes` | now |
| `_memory_bytes` | the processes' own memory: heap, stack, and what is waiting in their queues |
| `_reductions_per_sec` | what they did over the interval |
| `_work_pct` | their share of everything the node did |
| `_message_queue_len`, `_message_queue_max` | messages waiting, in all, and in the longest queue |
| `_spawns_per_sec`, `_exits_per_sec`, `_failures_per_sec` | those that started, ended, and ended otherwise than they were meant to |
| `beam_app_ets_bytes` | the tables owned by the application's processes |
A process is of the application whose processes started it. The VM's own
processes, and those started from a shell, are of `none`. An application
that has stopped is reported as nothing for six readings more.
How a group is named:
| process | its group |
|---|---|
| registered as `MyApp.Repo` | `MyApp.Repo` |
| registered as `worker_12`, `MyApp.Registry.PIDPartition3` | `worker`, `MyApp.Registry.PIDPartition` |
| labelled `{:connection, 42}` with `:proc_lib.set_label/1` | `connection` |
| a server whose callback module is `MyApp.Worker` | `MyApp.Worker` |
| a supervisor whose callback module is `MyApp.Supervisor` | `MyApp.Supervisor` |
| a task given `MyApp.Report.build/2` to do | `MyApp.Report.build/2` |
| a task, or a process, given a function written in `MyApp.Report.build/2` | `fn in MyApp.Report.build/2` |
| started from another node with `:erpc` | `erpc.execute_call/4` |
A pool registers its workers as `worker_1` to `worker_50`. Under those
names each would be a line, and the pool would not have one. The number is
removed, and fifty workers are one line, added together. They can be told
apart in `beam_proc_*`.
The `:max_groups` largest groups are reported by name, and the rest
together as `other`.
A group that has a place keeps it, and is reported at every reading: as
nothing, while it has no processes. It loses its place when it has been
absent for more than six readings, so the last samples of its series are
of nothing. A group does not move into `other` while it is there to be
reported. What is in `other` is what arrived when there was no room, and
what came back after losing its place. Once there has been an `other`,
there is one at every reading.
### Processes: `beam_proc_*`
For each process older than `:min_age` (30 seconds) that is registered
under a name, or is notable: it holds `:notable_memory` (16 MiB), or has
`:notable_queue` (1000) messages waiting, or does `:notable_work` (1%) of
what the node does. For `:max_processes` (200) of them at most, those with
names first. Labels: `proc` (`MyApp.Repo<0.512.0>`), `pid`, `group`, `app`.
| metric | is |
|---|---|
| `beam_proc_reductions_per_sec` | what it did over the interval |
| `beam_proc_work_pct` | its share of everything the node did |
| `beam_proc_reductions` | what it has done in its life so far |
| `beam_proc_memory_bytes` | its heap, its stack, and what is waiting in its queue |
| `beam_proc_message_queue_len` | messages waiting |
`:max_processes` is how many have series at once, and not how many ever
have: a process that ends leaves its series behind, and its place goes to
the next. On a node where jobs of a minute or so come and go, that was 43
new series a minute, which is ten thousand in an afternoon and a million
in sixteen days. For finding what is wrong that is nothing. A collector
that is left running can be told to give series only to what stays
(`min_age: "5m"`), or to no process (`max_processes: 0`), and has the
applications and the groups, which are bounded, all the same.
[DESIGN.md](DESIGN.md#how-many-series-that-is-over-time) has the
measurements.
### The collector: `beam_acct_*`
`beam_acct_processes`, `beam_acct_processes_reported`, `beam_acct_groups`,
`beam_acct_sweep_seconds`, `beam_acct_sweep_interval_seconds`,
`beam_acct_reductions_accounted_pct`, `beam_acct_spawns`,
`beam_acct_exits`, `beam_acct_trace_listening`,
`beam_acct_trace_suspensions`, `beam_acct_trace_waiting`,
`beam_acct_records_dropped`, `beam_acct_ticks_dropped`,
`beam_acct_remarks`, `beam_acct_remarks_dropped`.
`beam_acct_reductions_accounted_pct` is how much of what the node did the
sweep found a process for. What is missing was done by processes that no
sweep saw, or between a process's last sweep and its end.
A rising `beam_acct_trace_suspensions` means processes are starting
faster than they can be heard of. A rising `beam_acct_records_dropped`
means more are ending in a tick than there are records kept of.
### Accounting records
One log entry per process that ended. The message reads:
```text
MyApp.Worker<0.512.0> exited normal after 2.5s, 12.4k reductions, peak memory 2.1 MiB
Busy.Request.handle/1<0.10261.0> crashed: RuntimeError after 202µs
MyApp.Session<0.7714.0> killed after 4m07s, 1.2M reductions, peak memory 340 MiB
```
Indexed: `service` (the group), `host`, `status` (how it ended), `path`
(what it was started with). And as typed metadata:
| field | |
|---|---|
| `pid`, `name`, `app`, `node` | |
| `parent`, `parent_name` | the process that started it, and that process's group |
| `caller` | the process it was started on behalf of, if that is another |
| `status` | `normal`, `shutdown`, `killed`, or the first word of the reason: `timeout`, `noproc`, `badmatch`, `RuntimeError` |
| `reason` | the reason, written out and cut short. Absent when it ended normally |
| `crashed`, `at` | it ended by raising, and where |
| `started`, `elapsed_seconds` | |
| `seen_seconds` | in their place, for a process that was already running when the collector started: it lived longer than that |
| `reductions`, `memory_bytes`, `peak_memory_bytes`, `message_queue_len` | as of the last sweep that saw it: a floor. Absent if no sweep did |
| `figures_age_seconds` | how long before its end that was |
| `trace_id`, `span_id` | its span |
| `source` | `traced`: the VM's word. `sampled`: the process was noticed gone |
The times of a record are the VM's and are exact. Its figures are those of
the last sweep that saw the process alive, because the VM says that a
process ended and not what it had used; see
[DESIGN.md](DESIGN.md#what-the-vm-does-not-say).
| a process that | has a record at level |
|---|---|
| ended, or was told to shut down | info |
| ended for a reason of its own: `exit(:timeout)` | notice |
| was killed | warning |
| raised, and nothing caught it | error |
`:exit_levels` changes them, and `records: :abnormal` keeps a record only
of those that did not end as they were meant to.
### Remarks
One log entry for each thing the VM remarked on, with `kind` and `status`
as one of:
| kind | is | level |
|---|---|---|
| `long_gc` | a garbage collection took longer than `:long_gc` (100 ms) | notice |
| `long_schedule` | a process ran for longer than `:long_schedule` (100 ms) without yielding | notice |
| `busy_port`, `busy_dist_port` | a process was held up by a busy port, or a busy connection to a node | notice |
| `large_heap` | a heap reached `:large_heap` (256 MiB) | warning |
| `long_message_queue` | a queue reached 10,000 messages; and again when it is back under 5,000 | warning |
```text
MyApp.Importer<0.902.0> took 340ms to collect garbage
MyApp.Mailer<0.411.0> has a long queue: 10.0k waiting
```
A remark of one kind about one process is recorded once in ten seconds,
and `:max_anomalies` (50) are recorded from one tick.
### Traces
One span per process that ended, of the same processes as the accounting
records and with the same figures.
| of a span | is |
|---|---|
| name | the group: `MyApp.Report.build/2` |
| service | the application it ran in |
| parent | the process it was started by, or on behalf of, if that is part of the same trace |
| status | `ok`, or `error` with `exited timeout`, `killed`, or `crashed: RuntimeError` |
| attributes | `process.pid`, `process.parent_pid`, `process.caller_pid`, `process.name`, `process.initial_call`, `process.app`, `process.exit.status`, `process.exit.reason`, `process.exit.at`, `process.reductions`, `process.peak_memory_bytes`, `process.start_known`, `process.source` |
So in anything that reads traces, the services are the applications of
the node, and the operations of a service are the groups that ran in it.
**A trace is a job**: a process that a supervisor started, and everything
that process started, and so on down. A request is one, and so is a task.
A task is part of the job of the process that asked for it, whichever
process started it.
A server's processes never end, so a process is part of the trace of the
process that started it only if it started within an hour of that trace
(`:trace_max_age`). After that, each thing a server starts is the root of
a trace of its own.
## Looking
From a shell on the node:
```elixir
TimelessBeamAcct.top() # as of the last sweep
TimelessBeamAcct.top(sort: :memory, n: 10)
TimelessBeamAcct.top(app: "my_app", sort: :queue)
TimelessBeamAcct.exits(since: "-15m", status: "killed")
TimelessBeamAcct.exits(since: "09:00", group: "MyApp.Worker")
TimelessBeamAcct.exits(since: "-1h", app: "my_app", failed: true)
TimelessBeamAcct.exits(since: "-1h", summary: true) # by group, as sa(8) does
TimelessBeamAcct.exits(since: "-1h", summary: true, by: :app)
TimelessBeamAcct.exits(kind: "long_gc") # what the VM remarked on
TimelessBeamAcct.trees(since: "-5m") # jobs, as trees
TimelessBeamAcct.trees(group: "MyApp.Report.build/2", failed: true)
TimelessBeamAcct.status()
```
```text
COUNT FAILED REDS ELAPSED PEAK MEM GROUP
500 11 - 129ms - Busy.Request.handle/1
1500 0 - 140ms - fn in Busy.Request.handle/1
2000 11 - 269ms - (all 2 groups)
```
That is twenty-one seconds of a node that answers some twenty-five
requests a second: 2,000 processes ended, none of them lived for a
millisecond, and no sweep saw any of them.
From a terminal, the same, of another node: `mix timeless_beam_acct.top`,
`.exits`, `.trees`, `.check`. And `.watch`, which is the next section.
Times are `now`, a distance back (`-90s`, `-15m`, `-2h`, `-1d`), a local
time today (`14:30`), a local date and time, epoch seconds, or a
`DateTime`.
These read what the collector has in memory: the processes as of the last
sweep, and the last `:history` (2000) records and spans. The history is
in the stores.
## Watching a node in a terminal
```sh
mix timeless_beam_acct.watch app@ohm --cookie secret
mix timeless_beam_acct.watch app@ohm --at "2026-09-29 03:12" --view jobs
mix timeless_beam_acct.watch --metrics-url http://127.0.0.1:8428 --node app@ohm
```
This is `timeless-acct watch`, of a node where that is of a host: the
same screen, and the same keys.
Four views of one moment: the groups, the processes, the jobs that ran in
the quarter of an hour before, and the processes that ended in it. Under
the groups and the processes is the last ten minutes of the row that is
picked.
| key | |
|---|---|
| `←` `→` | one reading back, forward: ten seconds, unless the collector was told otherwise |
| `,` `.` | a minute |
| `<` `>` | ten minutes |
| `[` `]` | an hour |
| `{` `}` | a day |
| `home` | the first moment in the store |
| `l`, `end` | now |
| `t` | go to a moment, typed: `-15m`, `14:30`, `2026-09-29 14:30` |
| `m` | go to the moment of the selected exit or job |
| `-` `+` | a longer stretch of the timeline, a shorter: ten minutes to a week |
| `tab`, `1` to `4` | the view |
| `↑` `↓`, `j` `k` | the row |
| `enter` | open the row: a group into its processes, a process or an exit into what is known of it |
| `esc` | back out of a group |
| `s` | sort by work, memory, queue, name |
| `a` | applications, in place of groups |
| `/` | show only what matches |
| `q` | quit |
What differs from the screen of a host is what a node has that a host has
not. Where that has units it has groups, and `a` shows the applications
in their place, as there it shows the slices. Work is a share of the
node's reductions, where there it is a share of a CPU. The third sort is
by the messages waiting, where there it is by I/O.
Across the top is the timeline: how busy the schedulers were over the
last hour, with `▲` under the moment looked at, `!` where a process
raised and nothing caught it, and `·` where one was killed. Looking for
what went wrong is looking along it; or finding it among the exits, with
`/` and `killed`, and pressing `m` to see the node as it was then.
`/` looks for what matches, in what is on the screen as it is typed, and
with `enter` in the store as far back as the timeline shows: a busy node
ends hundreds of processes a second, and the one looked for is seldom
among the last few.
**Now is what the collector in the node last read**, asked of the node.
It is as old as the collector's interval, and asking costs the node an
answer and no reading of its own: nothing is read of a node here that its
collector has not read already. A node is asked again when its collector
has read again, and for the first three hundred of its processes by what
they do, by what they hold, and by what they have waiting, and not for
all hundred thousand of them. Going into a group asks for the processes
of that group.
**Every other moment is read from the store**, which is the planes a
collector with the `:http` sink writes to. The collector says where they
are, and they are read over HTTP: a moment is one question, and is
answered in some forty milliseconds. Planes that want a token to be read
are given one with `--token`, or one each with `--metrics-token`,
`--logs-token`, and `--traces-token`: a token that may write is often one
that may not read.
Two things follow. Going back from now lands on the last moment the
planes hold, which is the collector's last reading or the one before.
And at any moment but now, the processes are those that had series of
their own, which is two hundred of them at most; now has every process
the collector has.
Without a node, only a store is watched, and now is the last moment in
it:
```sh
mix timeless_beam_acct.watch --metrics-url http://127.0.0.1:8428 \
--logs-url http://127.0.0.1:9428 --traces-url http://127.0.0.1:10428 --node app@ohm
```
A collector with any other sink writes to nothing that is read here, and
what is watched is now, with the processes that ended and the jobs that
ran as the collector has them in memory: the last two thousand of each.
Opening a process shows what it is, in which application, what it is
running, and the functions it is in; and, if it has ended since the
moment looked at, how: its reason, where it raised, what started it, and
its trace. Going into a group and then back through time stays in the
group.
`--print 120x40` draws the screen once, as text, for a script or for
where there is no terminal.
It is written on what Elixir and OTP have and nothing else, as the
collector is. From OTP 28 the VM reads a terminal a key at a time; before
that the terminal is told to give one, with `stty`. It runs where it is
typed, and is no part of what `attach` puts into a node.
## Cost
Measured on a 22-CPU workstation, OTP 29. `bench/` has what measured it.
**A node with something going on**: `examples/busy_node.exs`, which
answers requests, each a process that starts three tasks. 130 processes,
84 of them with series of their own, 105 groups, and about 200 processes
ending every second.
| | |
|---|---|
| collector CPU | about 2% of one CPU by its reductions: 500,000 a second, of which the writer's encoding is two thirds. Measured the plain way, as the node's CPU with the collector and without it, on `bench/watch_node.exs`, which ends 65 processes a second and is the heaviest node here: **4 to 6% of one core**. That is the figure to plan with |
| collector memory | under 100 KiB between ticks, and 4.5 MiB for the records and spans kept in memory, and some 250 bytes a sample for the last reading |
| a sweep | 2 ms |
| samples | 1,500 a tick: 950 of groups, 250 of processes, 140 of tables, 90 of applications, 60 of the node |
| on the wire, to the planes | 160 KiB of samples a tick, uncompressed |
| accounting records | 500 bytes each on the wire |
| spans | 730 bytes each on the wire |
**A sweep**, by how many processes there are:
| processes | the first sweep | each sweep after | the table |
|---:|---:|---:|---:|
| 1,000 | 12 ms | 2.7 ms | 545 KiB |
| 10,000 | 86 ms | 15 ms | 4.7 MiB |
| 100,000 | 0.9 s | 0.17 s | 47 MiB |
| 500,000 | 6.3 s | 1.3 s | 233 MiB |
That is about two microseconds a process, and 470 bytes. A sweep may take
a tenth of one scheduler (`:sweep_budget`), which at ten seconds between
sweeps is a second: past 400,000 processes or so, sweeps are further
apart than was asked for.
**Listening**: the tracer hears of 200,000 processes a second starting
and ending, in full, for 12% of one scheduler, and of 10,000 a second for
0.6%. Past what it can hear, it stops listening and says so; a node
starting five million processes a second started as many with a collector
in it as without.
**A tick**, by how many processes ended in it:
| ended | the tick | encoding | on the wire |
|---:|---:|---:|---:|
| 1,000 | 17 ms | 12 ms | 1.3 MiB |
| 10,000 | 91 ms | 98 ms | 6.0 MiB |
| 100,000 | 0.57 s | 99 ms | 6.0 MiB |
Past `:max_records` (5,000) a tick, a process that ended is counted and
not described, which is six microseconds and nothing on the wire.
**What the planes make of it**: `bench/compression.exs`, which is an
hour of a node of five hundred processes doing twelve kinds of thing, 65
of them ending every second, sent to planes of timeless-libsql 0.8.5.
`bench/compression_report.py` reads what they stored.
| | sent | each, on the wire | each, stored | with its index | smaller by |
|---|---:|---:|---:|---:|---:|
| samples | 885,804 | 119 bytes | 3.9 bytes | 9.0 bytes | 92% (13:1) |
| accounting records | 235,225 | 497 bytes | 43 bytes | 45 bytes | 91% (11:1) |
| spans | 235,225 | 732 bytes | 27 bytes | 40 bytes | 94% (18:1) |
| all of it | | 376 MiB | 19.2 MiB | 26.7 MiB | **93% (14:1)** |
**What was sent was stored in 7% of the space: 93% compression, 14:1,
index included.** Of the compressed data alone, and without the index,
it is 95% (20:1), and of samples 97% (30:1).
Those are of timeless-libsql 0.8.5, whose planes compressed each
reading's chunk by itself and merged nothing. 0.8.6 merges them, and
six hours of the same node against it stored 5.25M samples in 85 to a
chunk: **0.9 bytes a sample** of data, **4.4 with its index**, which is
3.7% of the wire (27:1); and records and spans as before, 45 and 40
bytes each. All of it together, 6.1% of what was sent: 17:1, where
0.8.5 was 14:1.
"Each, stored" is of what was compressed and nothing else. "With its
index" is of every page in use in the file of the plane, which has in it
the series, the index of their chunks, and the indexes of records and of
traces. "Smaller by" is of that, against the wire, and the wire is the
body as it was sent: text, with the labels of a sample written out on
every line, and not compressed. Counted against the sixteen bytes that
a sample is before it is compressed, and without the index, samples are
75% smaller (4:1). These are gauges read every ten seconds, many of
them of processes that were there for a minute, and a chunk had 28
samples in it.
A day of that node is 183 MiB of samples, 243 MiB of records, and 216 MiB
of spans, by the same count. The files are larger than their pages in
use by what has been freed in them and not yet used again, which was
4.6 MiB of the metrics file and 1 MiB of each of the others.
**How long it is kept** is not for a collector to say. It keeps nothing,
and what it writes to keeps what it was told to:
| written to | samples | rollups | records and spans |
|---|---|---|---|
| planes started by hand | for good | none | for good |
| `timeless_stack` 0.7.23 | 7 days | an hour for 30 days, a day for a year, 30 days for good | 7 days |
| the stores of `timeless_phoenix` 2.0.3 | 7 days | a day for 90 days | 7 days |
With samples, records, and spans kept for a week, a store comes to a
week of them and stays there. Its series do not: a series whose samples
have all gone is still a series. See "How many series that is, over
time" in [DESIGN.md](DESIGN.md).
What moves the cost, in order: how many processes end (`:max_records`,
`records: :abnormal`, `traces: false`), how many processes there are
(`:process_interval`, `:sweep_budget`), and how many groups and named
processes there are (`:max_groups`, `:max_processes`).
## Options
`TimelessBeamAcct.Options` lists them all. The ones that matter:
| option | default | |
|---|---|---|
| `:sink` | `:http` | `:http`, `:timeless`, `:stdout`, `:forward`, or a module |
| `:host` | the hostname | the name this host is recorded under |
| `:node` | the node's name | the name this node is recorded under |
| `:interval` | `10` | seconds between readings of the node |
| `:process_interval` | `10` | seconds between sweeps of the processes |
| `:sweep_budget` | `0.1` | the share of one scheduler a sweep may take |
| `:min_age` | `30` | seconds a process must have lived to get series of its own |
| `:max_processes` | `200` | processes with series of their own |
| `:max_groups` | `200` | groups reported by name |
| `:exits` | `true` | ask the VM for word of each process that starts and ends |
| `:descriptions` | `true` | and of what each task is given to do, and what each process labels itself |
| `:records` | `:all` | which exits get a record: `:all`, `:abnormal`, or `:none` |
| `:max_records` | `5000` | records kept from one tick |
| `:traces` | `true` | keep a span for each process that ends |
| `:trace_max_age` | `"1h"` | how long after a job starts a process may start and be part of its trace |
| `:anomalies` | `true` | record what the VM remarks on (OTP 28) |
| `:token` | | planes: a bearer token, if they require one |
| `:metrics_token`, `:logs_token`, `:traces_token` | `:token` | planes: the token of one plane |
| `:backlog` | `360` | planes: ticks kept while a plane is unreachable |
A length of time is a number of seconds, or is written: `"90s"`, `"15m"`.
If a plane is unreachable, the collector keeps up to an hour of ticks and
sends them, in order and at the times they were taken, when it answers.
One plane being down does not hold back what is for the others.
Planes started with `TIMELESS_AUTH_MODE=required` take a token each: a
token is issued for one signal, and the plane of another answers it with
401. So there are three, from `timeless-authctl token mint --signal
metrics`, `logs`, and `traces`, given as `:metrics_token`, `:logs_token`,
and `:traces_token`.
## Reporting a problem
[Issues](https://github.com/awksedgreep/timeless_beam_acct/issues) are
where. What will be asked for is what this prints, from a shell on the
node or from a terminal:
```elixir
iex> TimelessBeamAcct.diagnostics()
```
```sh
mix timeless_beam_acct.diagnostics app@ohm --cookie secret
```
It has the versions, what the node lets a collector see, what the
collector was told, and what it has counted and let go. A bearer token is
not printed. The names of processes are not in it, and those of
applications are not either.
If what is wrong is a figure, say what it was expected to be and where
that was read: `:observer`, `:recon`, or the application's own count.
## What is not here yet
- **What a process had used when it ended.** A record has the figures of
the last sweep that saw the process. The VM does not say more to a
tracer that is a process; one that is native code could ask.
- **A limit to the series of processes, over time.** There is one to how
many have series at once.
- **Reading the stores in the node.** `watch` reads the planes. What a
collector with the `:timeless` sink writes to the stores of its own
node is not read by it yet, and that node is watched as it is now.
`top`, `exits`, and `trees` read what the collector has in memory.
- **Jobs that are running, in `watch`.** A job is there when its
processes have ended. `timeless-acct watch` has the running ones first.
- **What the VM remarked on, in `watch`.** A long garbage collection is a
record, and is on a canvas and in `exits(kind: "long_gc")`, and has no
view.
- **The page, beside the stores in the node.** The page in LiveDashboard
reads and records to the Timeless planes. An application with
timeless_phoenix's stores in the node and no planes has the page in its
menu, and nothing for it to list or record to.
- **Removing a recording.** It waits on the planes being able to remove
what a recording wrote
([timeless-libsql #117](https://github.com/awksedgreep/timeless-libsql/issues/117)).
- **A page that only reads.** Who may record is the router's to say
([Securing it](#securing-it)); the page has no switch of its own.
- **Memory a process holds outside its heap.** Large binaries are counted
once, for the node, in `beam_vm_mem_binary_bytes`, and not against the
processes that hold them.
- **Ports.** A socket is accounted in the I/O of the node, and not as
itself.
- **Jobs longer than an hour.** What a job starts after its first hour is
a trace of its own.
[DESIGN.md](DESIGN.md#what-is-not-here-yet) has the reasoning and the order.
## Testing
```sh
mix test
mix test --exclude distributed # without starting other nodes
```
Identity and endings are tested against terms written by hand, the
collectors against readings written by hand and against the live VM, the
tracer and the collection loop against processes the tests start, the
HTTP sink against a server the tests run, and putting a collector into a
node against nodes the tests start and stop.
The screen of `watch` is tested as the text on it: against a node and a
store written by hand, against a collector in the node that runs the
tests, and against a plane that answers what the test tells it to. A
test has no terminal. For the screen on one, with keys pressed at it:
```sh
scripts/pty_keys.py --size 120x40 --keys 'j,j,\r,1.5,\x34,q' -- \
mix timeless_beam_acct.watch app@ohm --cookie secret
```
prints what the terminal would show after them.
### Against the planes
`test/planes_test.exs` writes one tick through the HTTP sink to planes
that are running and reads it back from each: the samples, the records,
and the spans, with their times and their types. It is not part of
`mix test`, and is run before a release, against planes started for it:
```sh
ext=/path/to/libtimeless_ext.so
mkdir -p /tmp/planes
timeless-metrics-api $ext /tmp/planes/metrics.db 127.0.0.1:28428 &
timeless-logs-api $ext /tmp/planes/logs.db 127.0.0.1:29428 &
timeless-traces-api $ext /tmp/planes/traces.db 127.0.0.1:30428 &
TIMELESS_TEST_METRICS_URL=http://127.0.0.1:28428 \
TIMELESS_TEST_LOGS_URL=http://127.0.0.1:29428 \
TIMELESS_TEST_TRACES_URL=http://127.0.0.1:30428 \
mix test --only planes
```
It must be told where all three are, and refuses ports 8428, 9428, and
10428 of the machine it runs on, which are where the planes of whoever
works on that machine are. For planes that require a token there are
`TIMELESS_TEST_METRICS_TOKEN`, `TIMELESS_TEST_LOGS_TOKEN`, and
`TIMELESS_TEST_TRACES_TOKEN`.
The tests ask nothing of the planes of the machine they run on.
[docs/RELEASING.md](https://github.com/awksedgreep/timeless_beam_acct/blob/main/docs/RELEASING.md) is what is run before a version is
tagged: the suite on each OTP, the planes, and what a person will do
first.
## License
[MIT](LICENSE)