Current section
Files
Jump to
Current section
Files
README.md
# Stampede
[](https://hex.pm/packages/stampede)
[](https://github.com/mandar1045/stampede/actions/workflows/ci.yml)
[](https://stampede.hexdocs.pm)
[](https://github.com/mandar1045/stampede/blob/main/LICENSE)
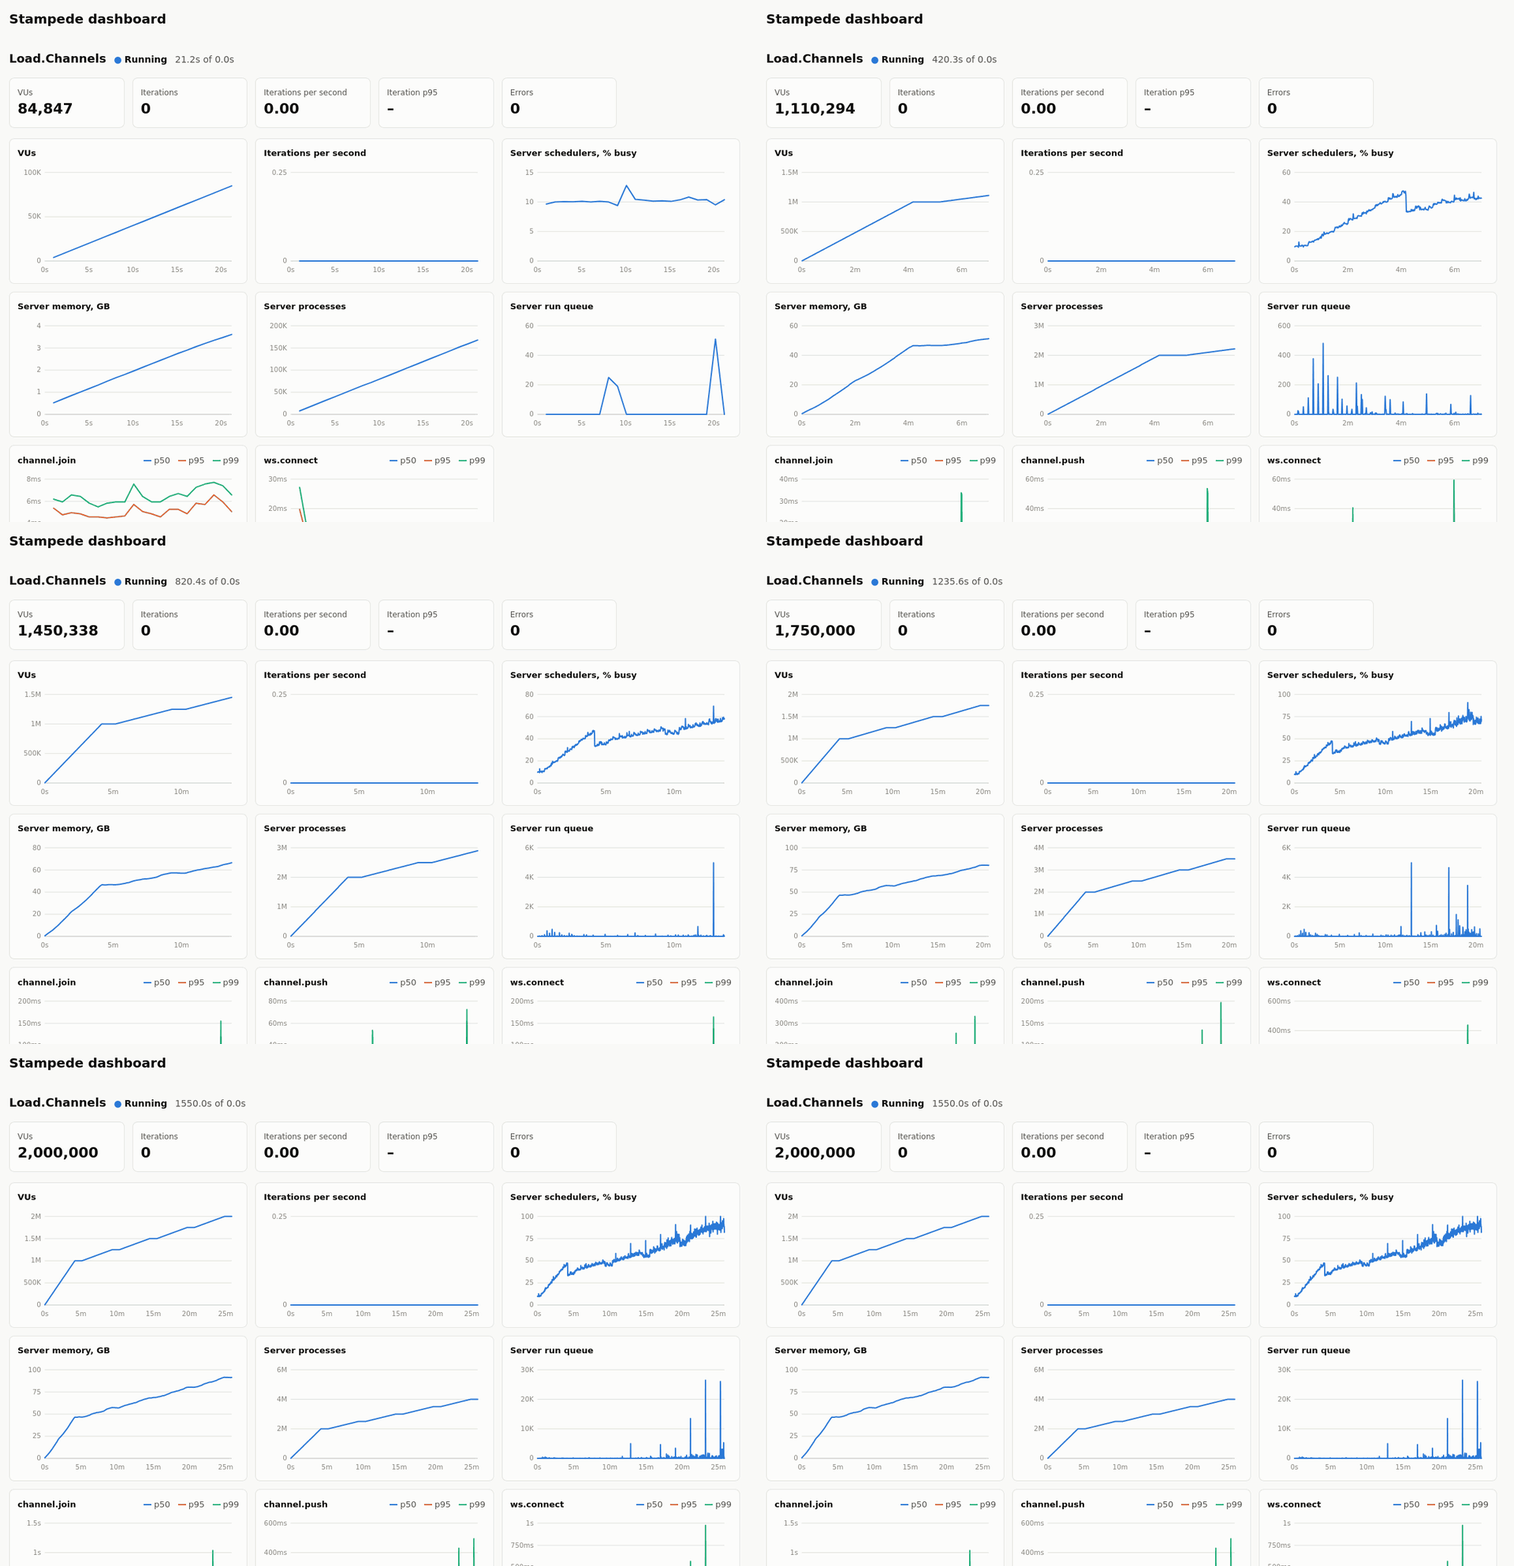
Load testing for Phoenix that speaks Phoenix: Channels, LiveView, HTTP and
plain WebSockets, with scenarios written in Elixir. It load tests AI chat APIs
too, such as Ollama or vLLM.
| What I load tested | On one machine | It held |
|---|---|---|
| Stock Phoenix, with Channels | 16 cores, 128 GB | **2,000,000 users** |
| Stock Phoenix, with Channels | 4 cores, 32 GB | **600,000 users** |
| A real open source Phoenix product, with 100 users in each channel | 4 cores, 32 GB | **50,000 users for 10 minutes**, with 80.9 million messages delivered |
| A chat app that keeps every message in Postgres, 100 million of them | 16 cores, 128 GB, with Postgres on 8 more | **40,000 users**, each one reading and writing the database |
What it does for you:
* **Finds your limit.** `--find-limit` adds users until your thresholds break,
and tells you the most that held.
* **Writes the test for you.** `mix stampede.record` turns you clicking through
your app into a load test, signing in included.
* **Sees inside your app.** `--probe` shows what the server and its database
were doing during the run, and why a step broke, with no changes to your app.
* **Knows Phoenix.** Joins, heartbeats, LiveView tokens and uploads are handled
for you, so a scenario is just what a user does.
* **Fits your workflow.** Scenarios are plain Elixir, a failed threshold fails
your CI, and runs show up in your app's LiveDashboard and in Livebook.
[Install](#installation) ·
[First test](#your-first-load-test) ·
[Find your limit](#how-many-users-can-it-handle) ·
[Record a session](#recording-a-session) ·
[Inside your app](#inside-your-app) ·
[LiveView](#liveview) ·
[AI chat APIs](#ai-chat-apis) ·
[Livebook](#in-livebook) ·
[Guides](#guides)
## Why I built this
I wanted to see how a real-time Phoenix app held up with hundreds of people
in one channel. Generic load testers see a channel as just another
WebSocket, so the scripts end up building `phx_join` messages, refs and
heartbeats by hand. Chaperon, the Elixir load tester I found, hasn't had a
release since 2020. And "how do I load test LiveView?" keeps coming up on
Elixir Forum without a good answer.
So I wrote the tool I wanted. Stampede already knows the Channels protocol
and how a LiveView session starts, so a scenario is just what a user does.
Every virtual user (VU) is a BEAM process, which means one laptop can hold
thousands of connections, and when it can't, more machines can join over
Erlang distribution. Scenarios are plain Elixir modules, so they can call
your own code.
## Installation
The quickest way is [Igniter](https://hexdocs.pm/igniter), which also drops a
first scenario into `loadtest/home.exs`:
```console
$ mix igniter.install stampede
```
Without Igniter, add it to your dependencies:
```elixir
def deps do
[
{:stampede, "~> 1.4", only: [:dev, :test]}
]
end
```
You'll need Elixir 1.18 or newer.
## Your first load test
`mix stampede.gen.scenario Lobby --channels` gives you something to start
from. There's also `--live` and `--websocket`, and no flag gets you plain
HTTP. Written by hand, a channels scenario looks like this:
```elixir
defmodule MyApp.Load.Lobby do
use Stampede.Scenario
@impl true
def options do
[
stages: [{[second: 30], 500}, {[minute: 1], 500}, {[second: 10], 0}],
thresholds: [{"channel.join", p95: 250}, {"iteration.errors", count: 0}]
]
end
@impl true
def run(vu) do
{:ok, socket} = Stampede.Channels.connect("ws://localhost:4000/socket")
{:ok, _reply} = Stampede.Channels.join(socket, "room:lobby")
for _ <- 1..10 do
{:ok, _reply} = Stampede.Channels.push(socket, "room:lobby", "new_msg", %{body: "hi from #{vu.id}"})
Process.sleep(1_000)
end
end
end
```
Save it as `loadtest/lobby.exs` and run it:
```console
$ mix stampede.run loadtest/lobby.exs
```
That ramps up to 500 VUs over 30 seconds, holds them for a minute and ramps
back down, with a progress line every second. Each VU calls `run/1` over and
over. At the end you get a summary. This one is from a run with 6,000 VUs
across three nodes, all on my laptop along with the Phoenix app:
```
Demo.Chat ran for 15.0s
metric count rate/s mean p50 p90 p95 p99 max
channel.join 6000 399.89 10.72ms 5.49ms 18.59ms 31.90ms 97.77ms 103.81ms
channel.push 139348 9287.39 2.56ms 854µs 6.84ms 11.27ms 22.25ms 55.84ms
ws.connect 6000 399.89 16.28ms 11.50ms 28.29ms 35.25ms 134.64ms 209.06ms
thresholds
pass channel.join p95 <= 500.00ms (31.90ms)
pass iteration.errors count <= 0 (0)
```
If a threshold fails, the task exits with status 1, so it works in CI as it
is.
## Watching a run
Add `--dashboard` and open http://127.0.0.1:4040:
```console
$ mix stampede.run loadtest/lobby.exs --dashboard
```
That's the page in the animation at the top. It updates every second while
the test runs, and shows the full results when it's done.
If your app already has Phoenix LiveDashboard, you can watch from there
instead. Add Stampede's page to the dashboard's route:
```elixir
live_dashboard "/dashboard",
additional_pages: [stampede: Stampede.LiveDashboard]
```
Then a run with [`--probe`](#inside-your-app) shows up in a Stampede
tab while it runs, right next to the dashboard's processes and ports:
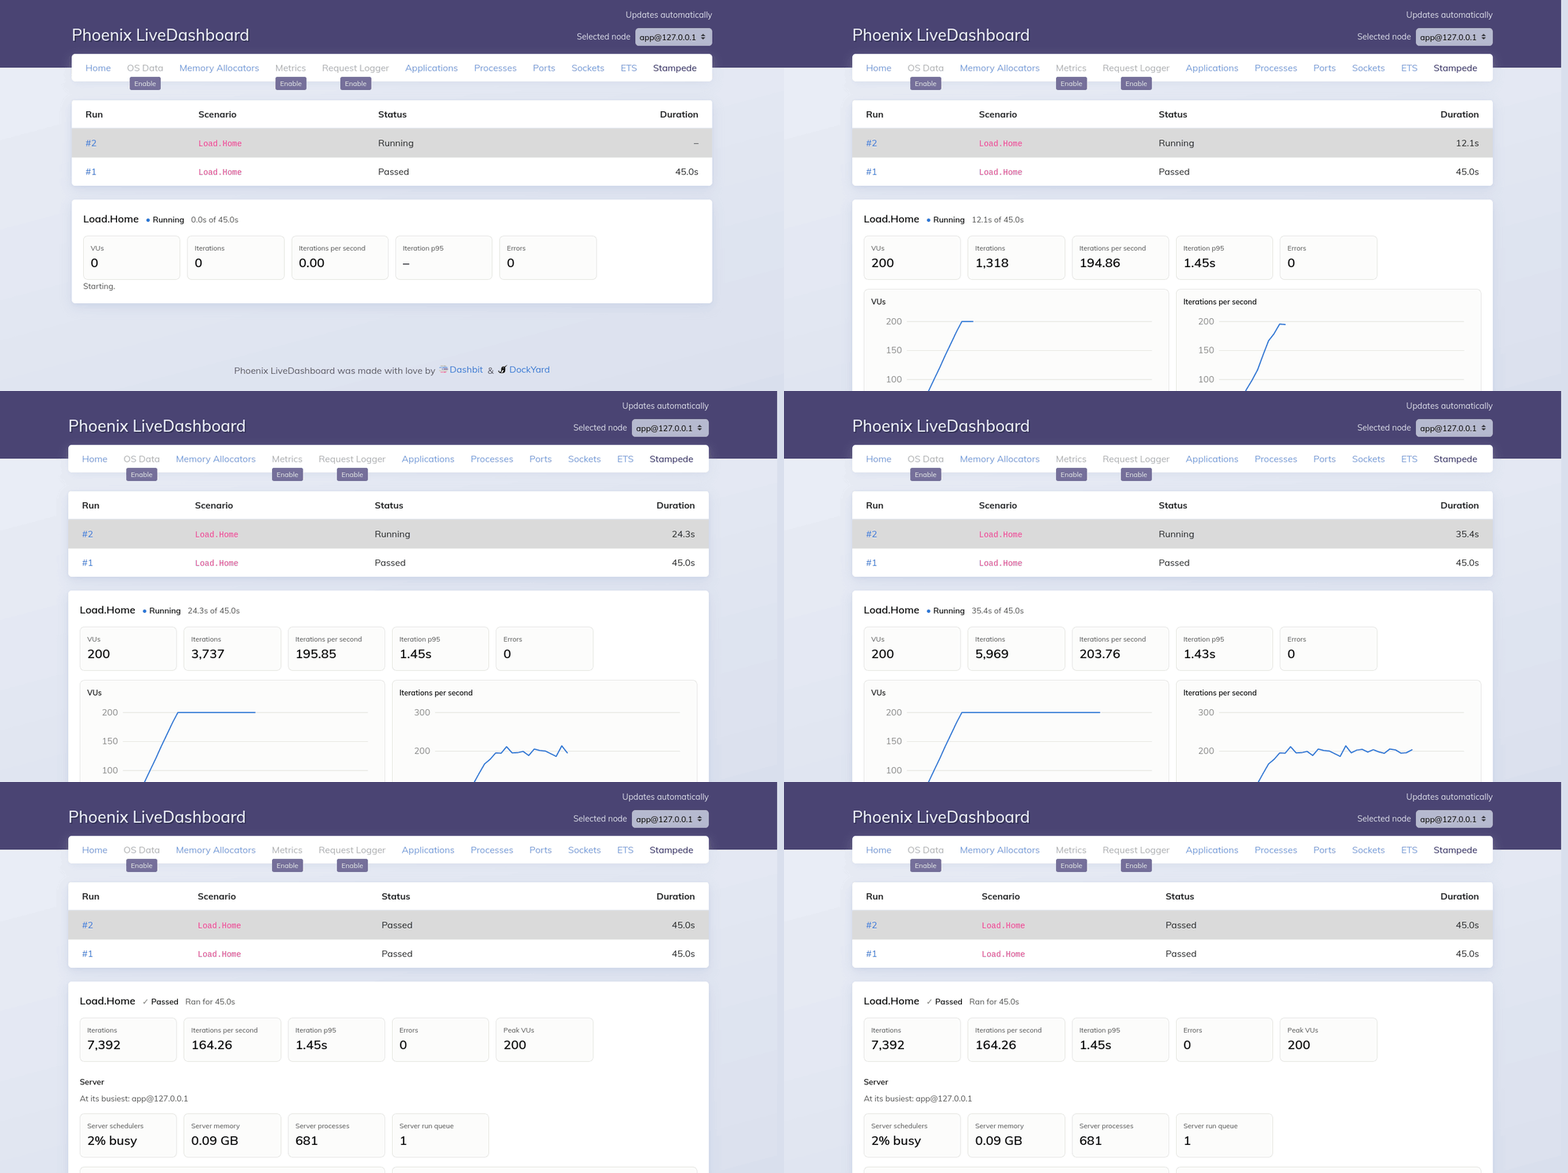
Finished runs stay there after the load test has gone, and the tab keeps the
last 20.
## How many users can it handle?
That's usually the real question, so Stampede can answer it directly:
```console
$ mix stampede.run loadtest/lobby.exs --find-limit
```
Instead of a fixed load, it adds users a step at a time and checks your
thresholds over each step. The first step that breaks one ends the run, and
the summary tells you the most users that passed.
Each step ramps for 5 seconds and holds for 30 by default. `--start`,
`--step`, `--up-to` and `--hold` change that, and `find_limit: [by: :rate]`
in a scenario's options steps up the arrival rate instead of users.
It's new in 1.2, so the options and the report may still change a little.
`--badge badge.svg` writes a badge with the result, for your README:

### 2,000,000 users on stock Phoenix
I tried it on AWS: stock Phoenix on one 16-core, 128 GB server, and Stampede on
eight smaller machines. Every user behaves like Phoenix's JavaScript client: it
joins a chat room, sends a heartbeat every 30 seconds and a message every 30 to
60, and stays. The load went up 250,000 users at a time, and a step only passed
with joins and messages under 1 second at p95 and no errors:
```console
$ mix stampede.run loadtest/channels.exs --find-limit --start 1000000 --step 250000 --up-to 3000000 --hold 60s
```
```
309.2s vus: 1000000 iterations: 0 errors: 0 load test busy: 22%
step 1,000,000 VUs: held
619.3s vus: 1250000 iterations: 0 errors: 0 load test busy: 25%
step 1,250,000 VUs: held
929.5s vus: 1500000 iterations: 0 errors: 0 load test busy: 29%
step 1,500,000 VUs: held
1239.6s vus: 1750000 iterations: 0 errors: 0 load test busy: 34%
step 1,750,000 VUs: held
1549.0s vus: 2000000 iterations: 0 errors: 0 load test busy: 39%
step 2,000,000 VUs: held
```
| Users | Server CPU | Server memory |
|---:|---:|---:|
| 1,000,000 | 37–48% | 52 GB |
| 1,250,000 | 47–52% | 64 GB |
| 1,500,000 | 54–60% | 77 GB |
| 1,750,000 | 67–71% | 90 GB |
| **2,000,000** | **78–84%** | **103 GB** |
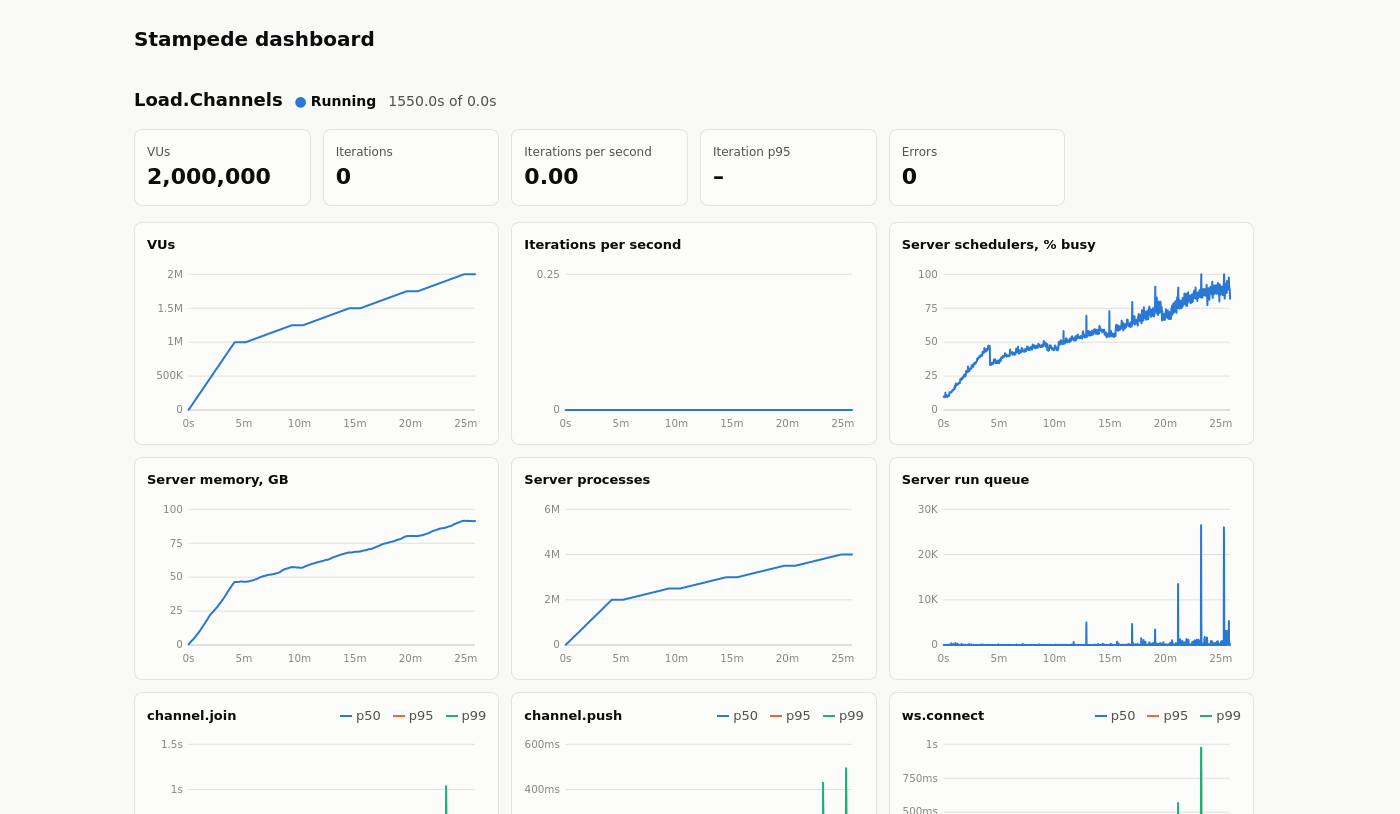
Two million users on one server, every one of them sending heartbeats and
messages, and no errors. Memory came to about 51 KB a user, so it was the CPU
that set the limit: two million users send well over 100,000 heartbeats and
messages a second. This is the dashboard at the end of the 2,000,000 step:
The best-known Phoenix number is the core team's 2 million connections from
2015, on a 40-core machine, where each connection joined a channel and then sat
idle. This was 16 cores, with every user active. Ten years of Phoenix and the
BEAM in one comparison, even if the hardware and versions make it far from a
strict one.
### 600,000 users on stock Phoenix
I tried it on AWS: stock Phoenix on one 4-core, 32 GB server, and Stampede on
three more machines of the same size. Every user behaves like Phoenix's
JavaScript client: it joins a chat room, sends a heartbeat every 30 seconds
and a message every 30 to 60, and stays. Each step ramps over 100 seconds:
```console
$ mix stampede.run loadtest/channels.exs --find-limit --start 100000 --step 100000 --up-to 600000 --hold 60s
```
```
159.6s vus: 100000 iterations: 0 errors: 0 load test busy: 6%
step 100,000 VUs: held
319.2s vus: 200000 iterations: 0 errors: 0 load test busy: 11%
step 200,000 VUs: held
479.8s vus: 300000 iterations: 0 errors: 0 load test busy: 16%
step 300,000 VUs: held
639.5s vus: 400000 iterations: 0 errors: 0 load test busy: 21%
step 400,000 VUs: held
799.1s vus: 500000 iterations: 0 errors: 0 load test busy: 27%
step 500,000 VUs: held
959.8s vus: 600000 iterations: 0 errors: 0 load test busy: 31%
step 600,000 VUs: held
```
600,000 users on 4 cores, no errors, joins in 31ms and messages in 10ms at
p95. The server held them at 76% CPU and didn't log a single warning. Here's
the HTML report from the same run:
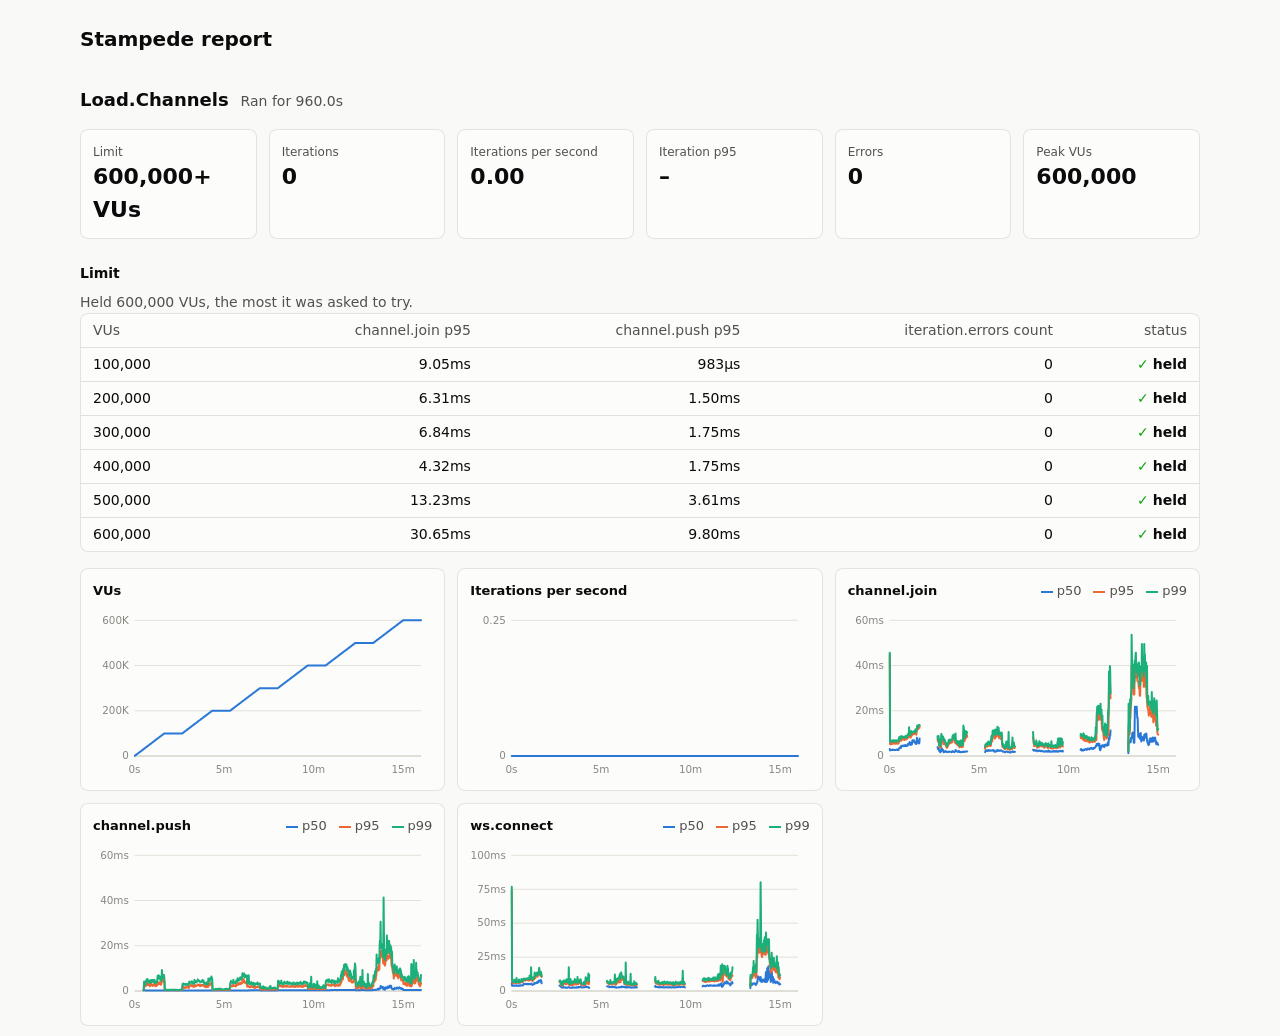
That's about as far as this server goes, because at 600,000 its memory was
98% full. Each connection took about 47 KB, so more memory means more users.
Everything you need to run these yourself, and every number they measured, is in
[`bench/million`](https://github.com/mandar1045/stampede/tree/main/bench/million).
### 50,000 users on a real product
A fresh app only tells you so much, so I tried a real one too: an open source
real-time server built with Phoenix, self-hosted from its official release, on
the same size of machine. With 100 users in each channel and every message
going to all of them, it held **50,000 users for 10 minutes**, delivered 80.9
million messages, and round trips stayed at 5.71ms at p95.
A load test saying it did well doesn't prove much, so I checked it against
things that don't come from Stampede. These are all real recordings from that
run, sped up:

The server's own metrics, in Grafana. It counted 50,001 users: the 50,000, plus
one real browser.
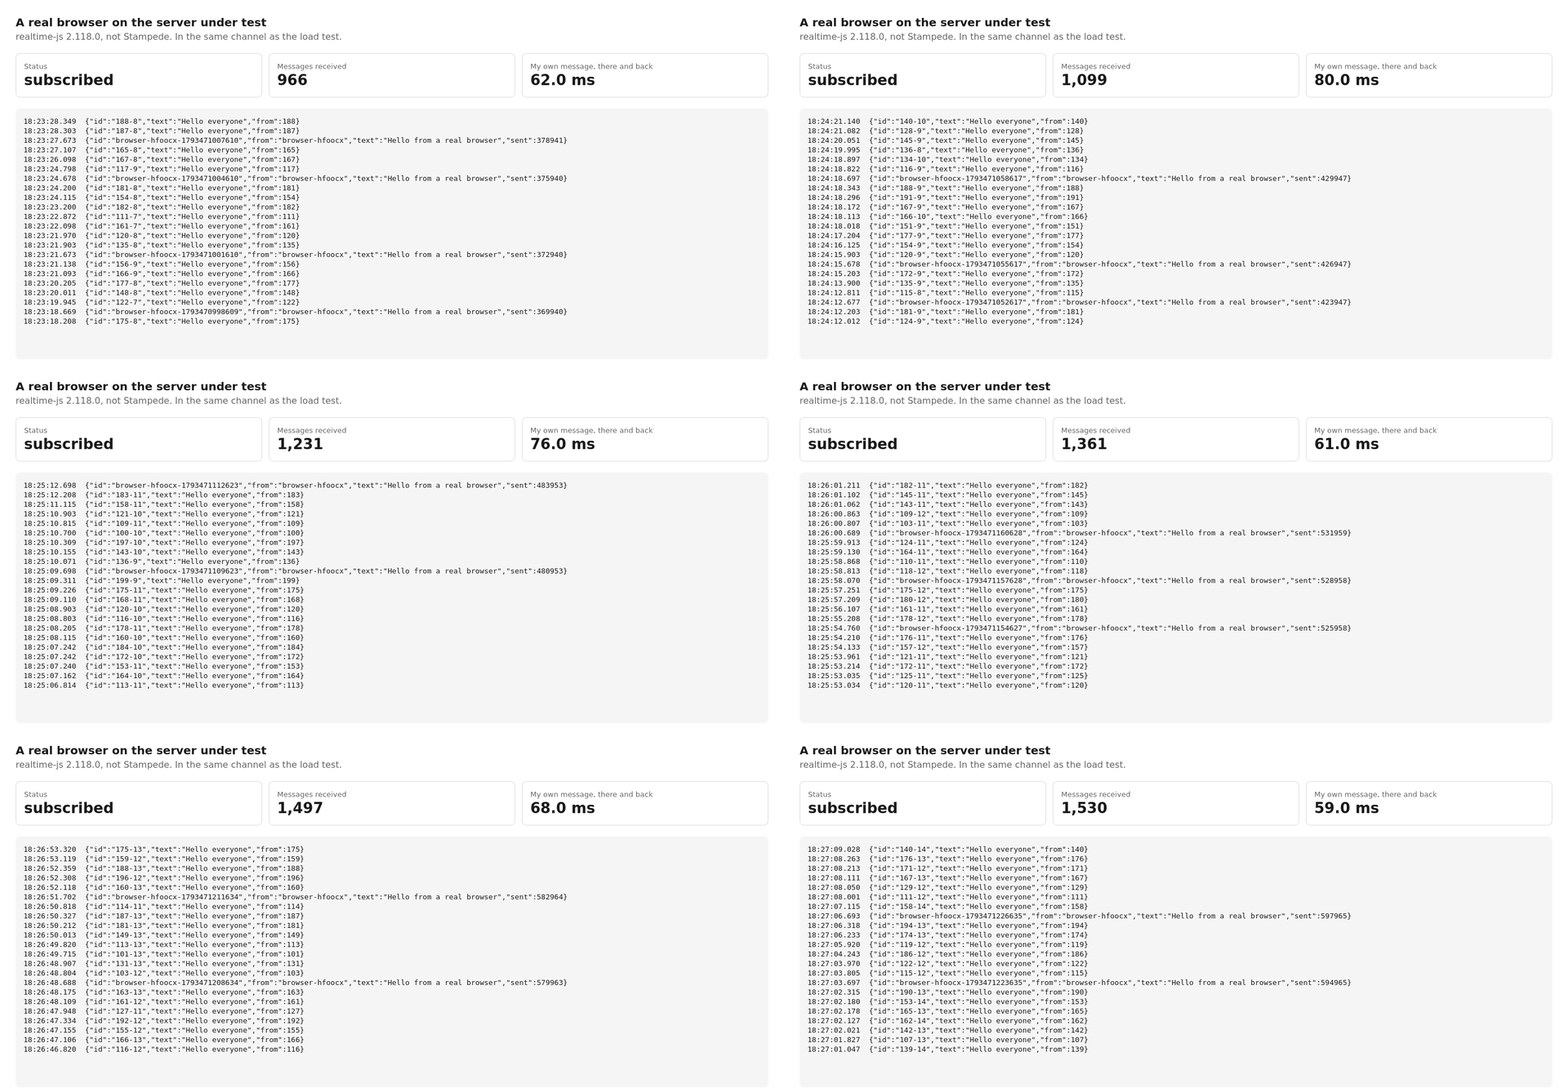
A real client in Firefox, not Stampede, in the same channel as the load test. They
received each other's messages.
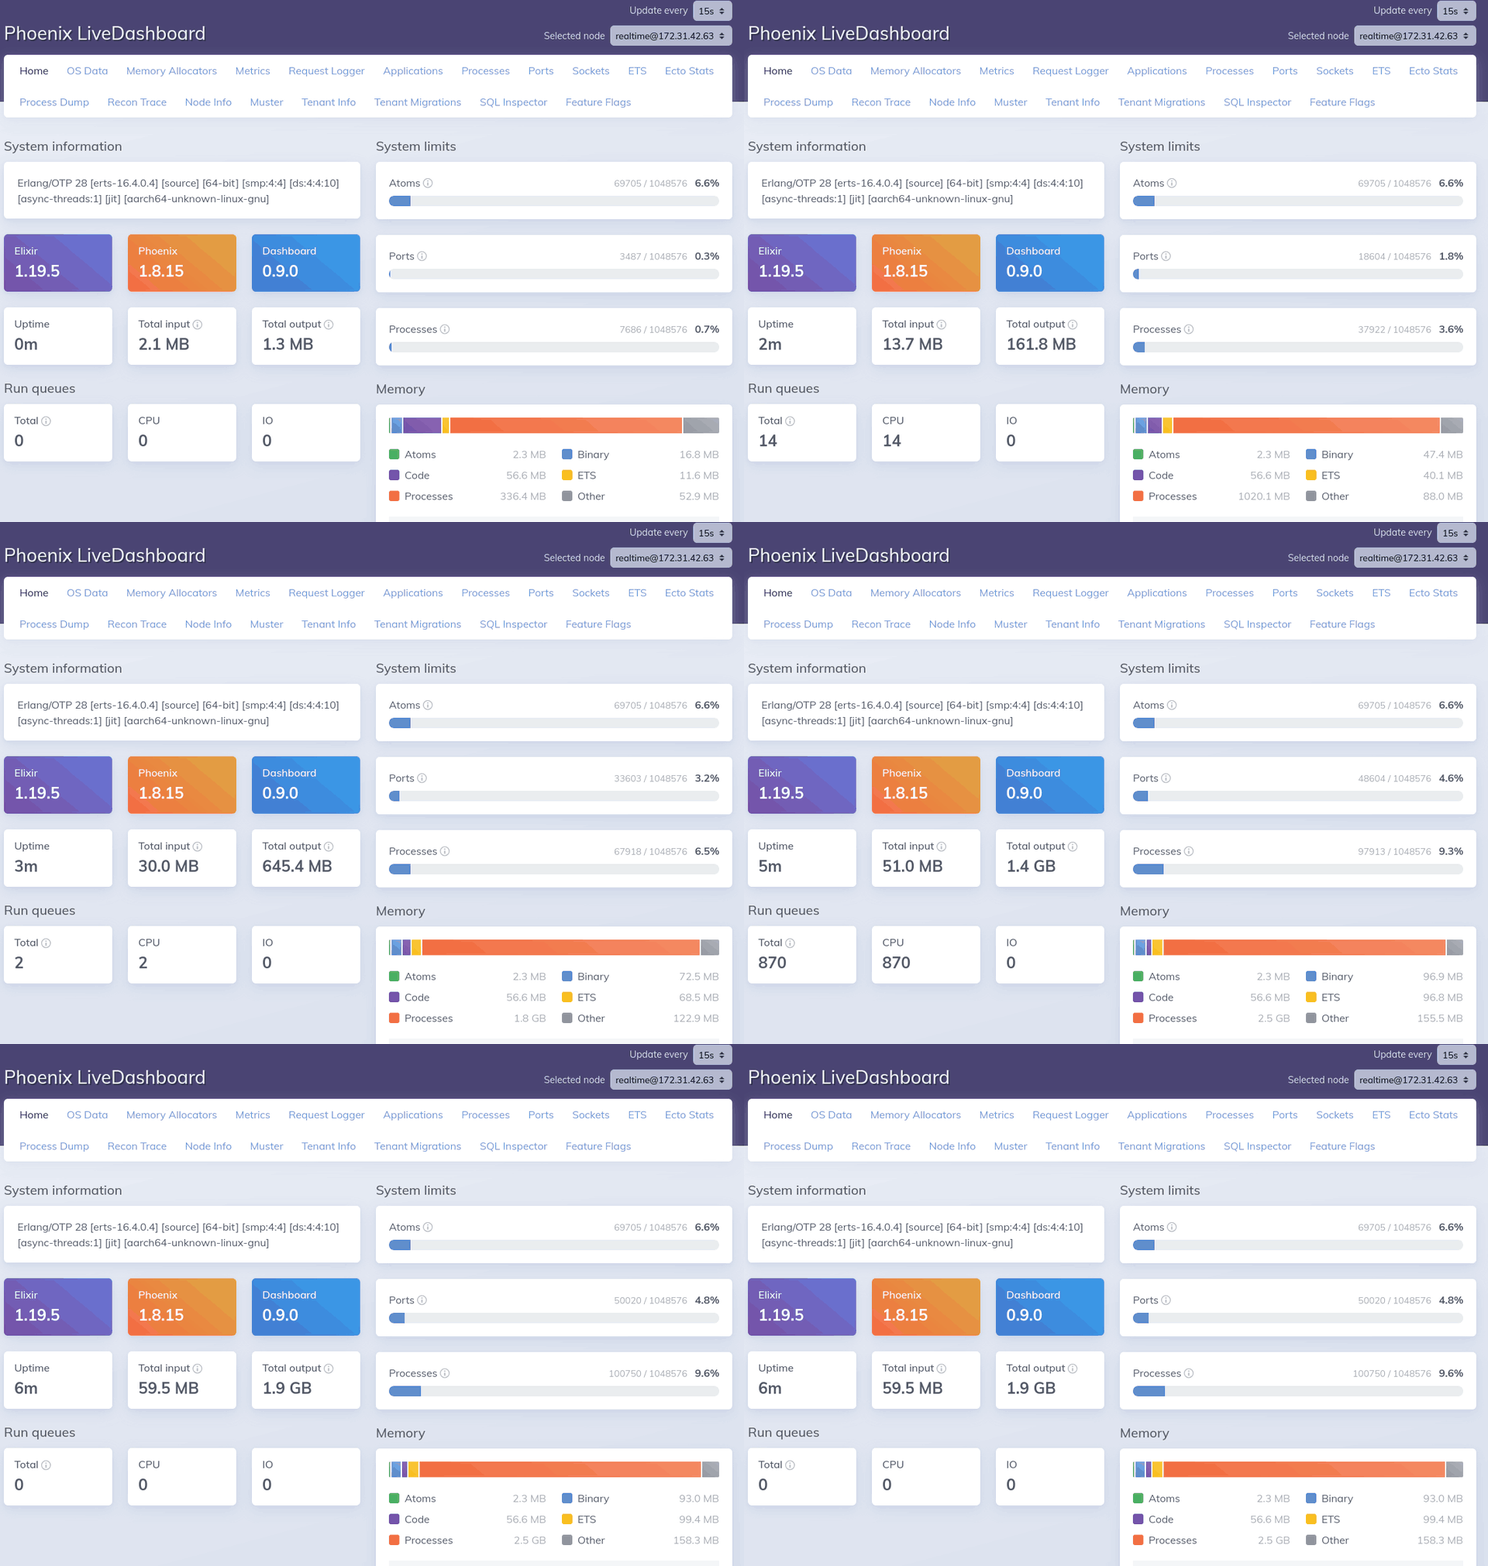
Phoenix LiveDashboard, inside the server: 4 schedulers on Arm, climbing to 50,020
ports and about 100,000 processes.
99.996% of the messages that should've arrived did, and the server logged no
errors or warnings until the users disconnected at the end. The load machines
peaked at 51%, so they weren't the limit. CPU was.
These are also in the repo as videos:
[Stampede's dashboard](https://github.com/mandar1045/stampede/blob/main/bench/million/results/20261031-realtime-hold-50k/videos/stampede-dashboard.mp4),
[Grafana](https://github.com/mandar1045/stampede/blob/main/bench/million/results/20261031-realtime-hold-50k/videos/grafana.mp4),
[LiveDashboard](https://github.com/mandar1045/stampede/blob/main/bench/million/results/20261031-realtime-hold-50k/videos/livedashboard.mp4)
and the
[real browser](https://github.com/mandar1045/stampede/blob/main/bench/million/results/20261031-realtime-hold-50k/videos/real-browser.mp4).
It's one workload, on public channels with no TLS, so the
[case study](https://stampede.hexdocs.pm/supabase_realtime.html) has what it doesn't show, and how to run
it yourself.
### 40,000 users on a chat app with a real database
The runs above barely touch a database, and the question I got most after the
2,000,000 one was what happens with a real one. So this is a chat app that
keeps every message in Postgres: a fresh `mix phx.new` app with Ecto's default
pool of 10, and Postgres 17 with its default settings on a machine of its own,
seeded with 1 million users, 10,000 rooms and 100 million messages. Each user
joins a room of about 100 people, which reads the room's latest 50 messages,
then every 30 to 60 seconds sends a message, which is written before the reply
comes back, or scrolls up for older ones.
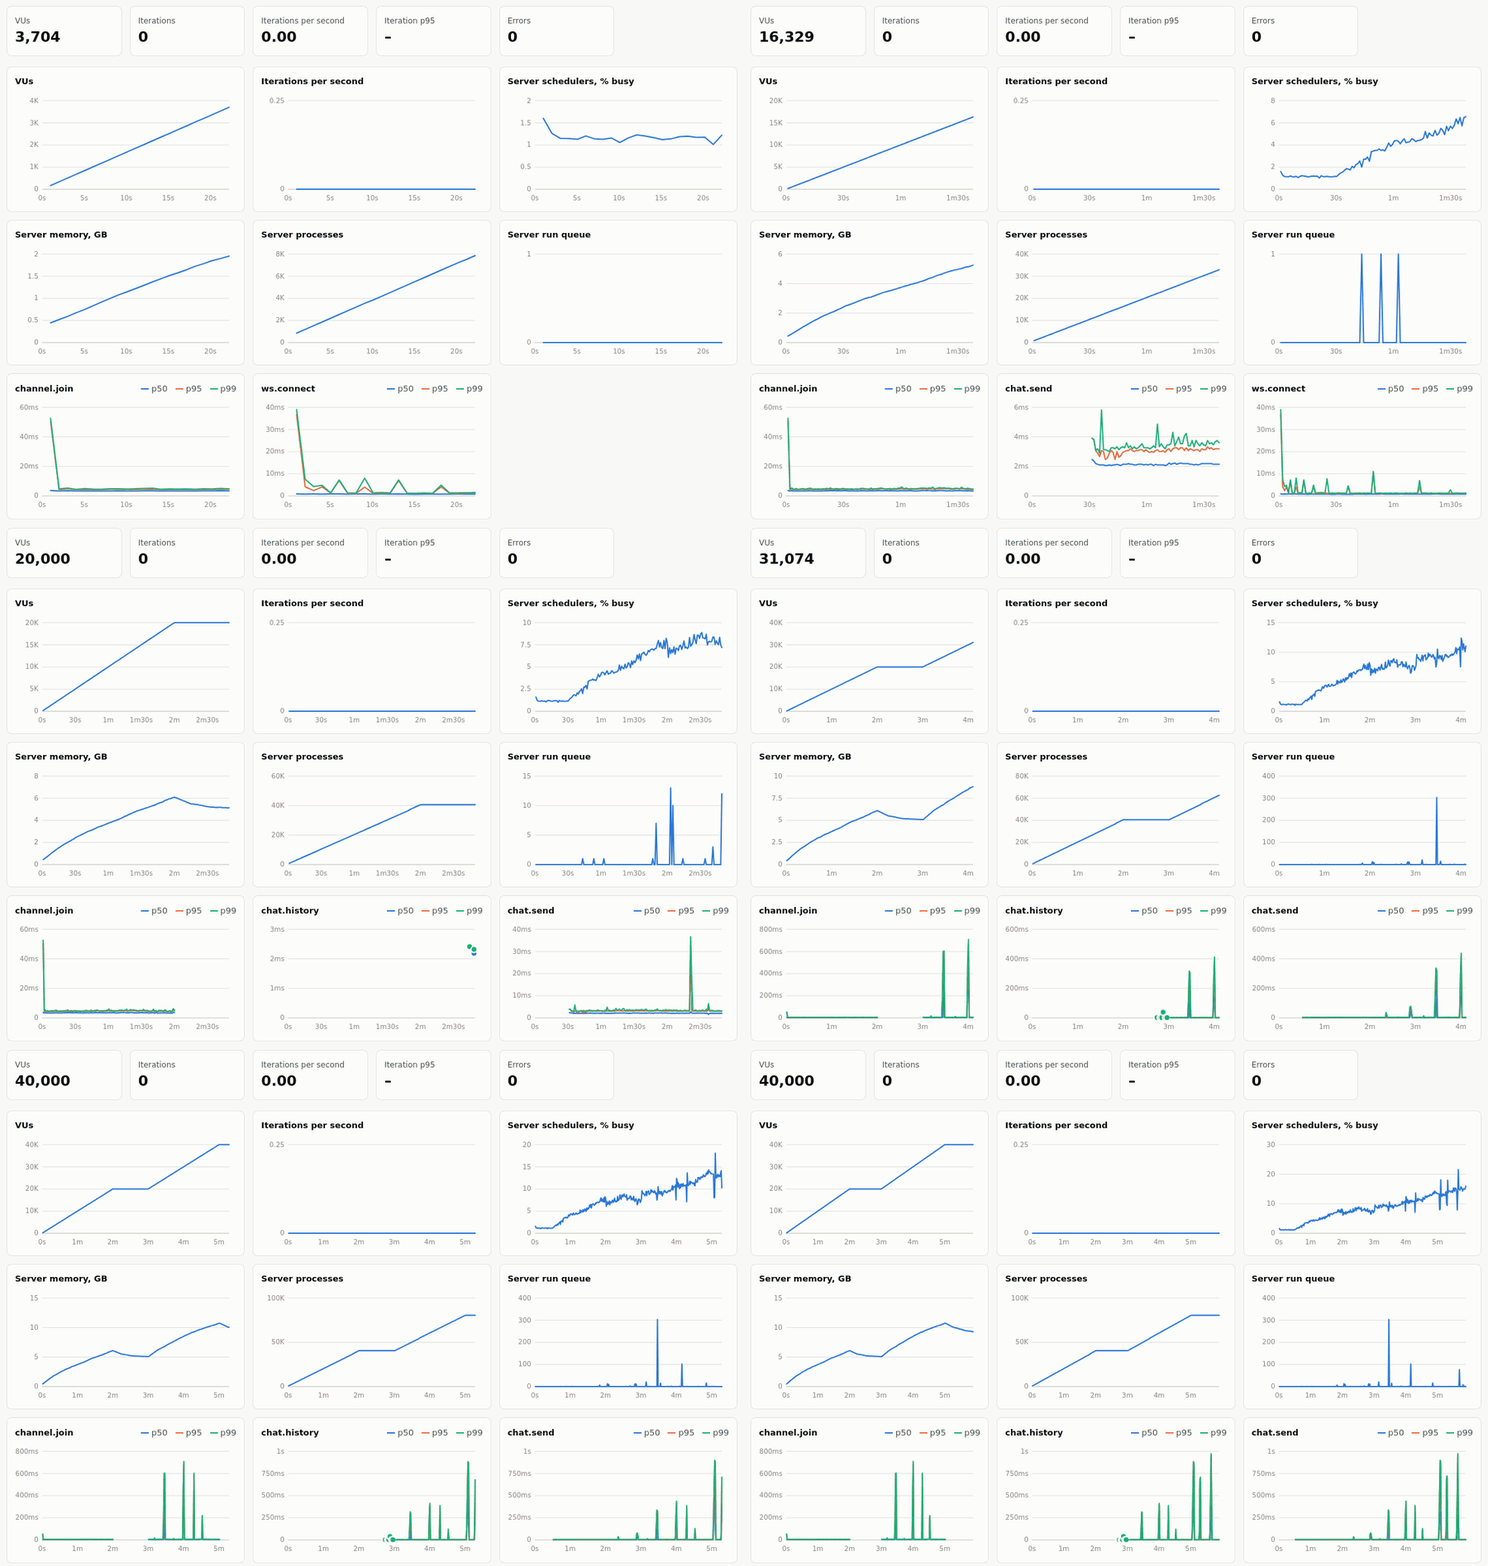
| Users | Join p95 | Send p95 | Scroll up p95 | Errors |
|---:|---:|---:|---:|---:|
| 20,000 | 4.58ms | 3.20ms | 38.96ms | 0 |
| **40,000** | **6.31ms** | **178.14ms** | **167.77ms** | **0** |
That's a much smaller number than 2,000,000, and it should be: every one of
those users reads and writes a real database. Past 40,000 it ran into three
limits at once: the app's schedulers were 96% busy, queries spent nearly all
their time waiting for one of the pool's 10 connections, and Postgres was
mostly waiting to write its log to disk. Working that out by hand is what made
me teach `--probe` to watch the database, so now the verdict says it for you. The app, the
seed and every log are in
[`bench/million`](https://github.com/mandar1045/stampede/tree/main/bench/million#a-chat-app-on-postgres-with-100-million-messages-november-8-2026).
### 12,000 LiveView users on my laptop
Before that, I'd tried it on my laptop: a fresh Phoenix app in production
mode, with a LiveView page where every user loads the page, joins, clicks
and stays for about 20 seconds. The limit was a p95 under 500ms for joins
and under 100ms for clicks:
```console
$ mix stampede.run loadtest/counter.exs --find-limit --start 1000 --step 1000 --up-to 12000 --hold 20s
```
| Users | Join p95 | Click p95 |
|---:|---:|---:|
| 1,000 | 2.67ms | 1.41ms |
| 4,000 | 3.46ms | 1.83ms |
| 8,000 | 6.57ms | 5.60ms |
| 12,000 | 11.97ms | 11.05ms |
So with the app and the load test sharing my laptop, Phoenix held 12,000
LiveView users with joins under 12ms at p95 and not a single error, and
Stampede never found where it breaks.
## Recording a session
Writing a LiveView scenario by hand means looking up event names and form
fields. Instead, you can click through your app once and let Stampede write it:
```console
$ mix stampede.record SignIn
```
That starts your app. Use it in the browser as a user would, then press Enter
in the terminal. Here it's recording a sign-in on a `phx.gen.auth` app:
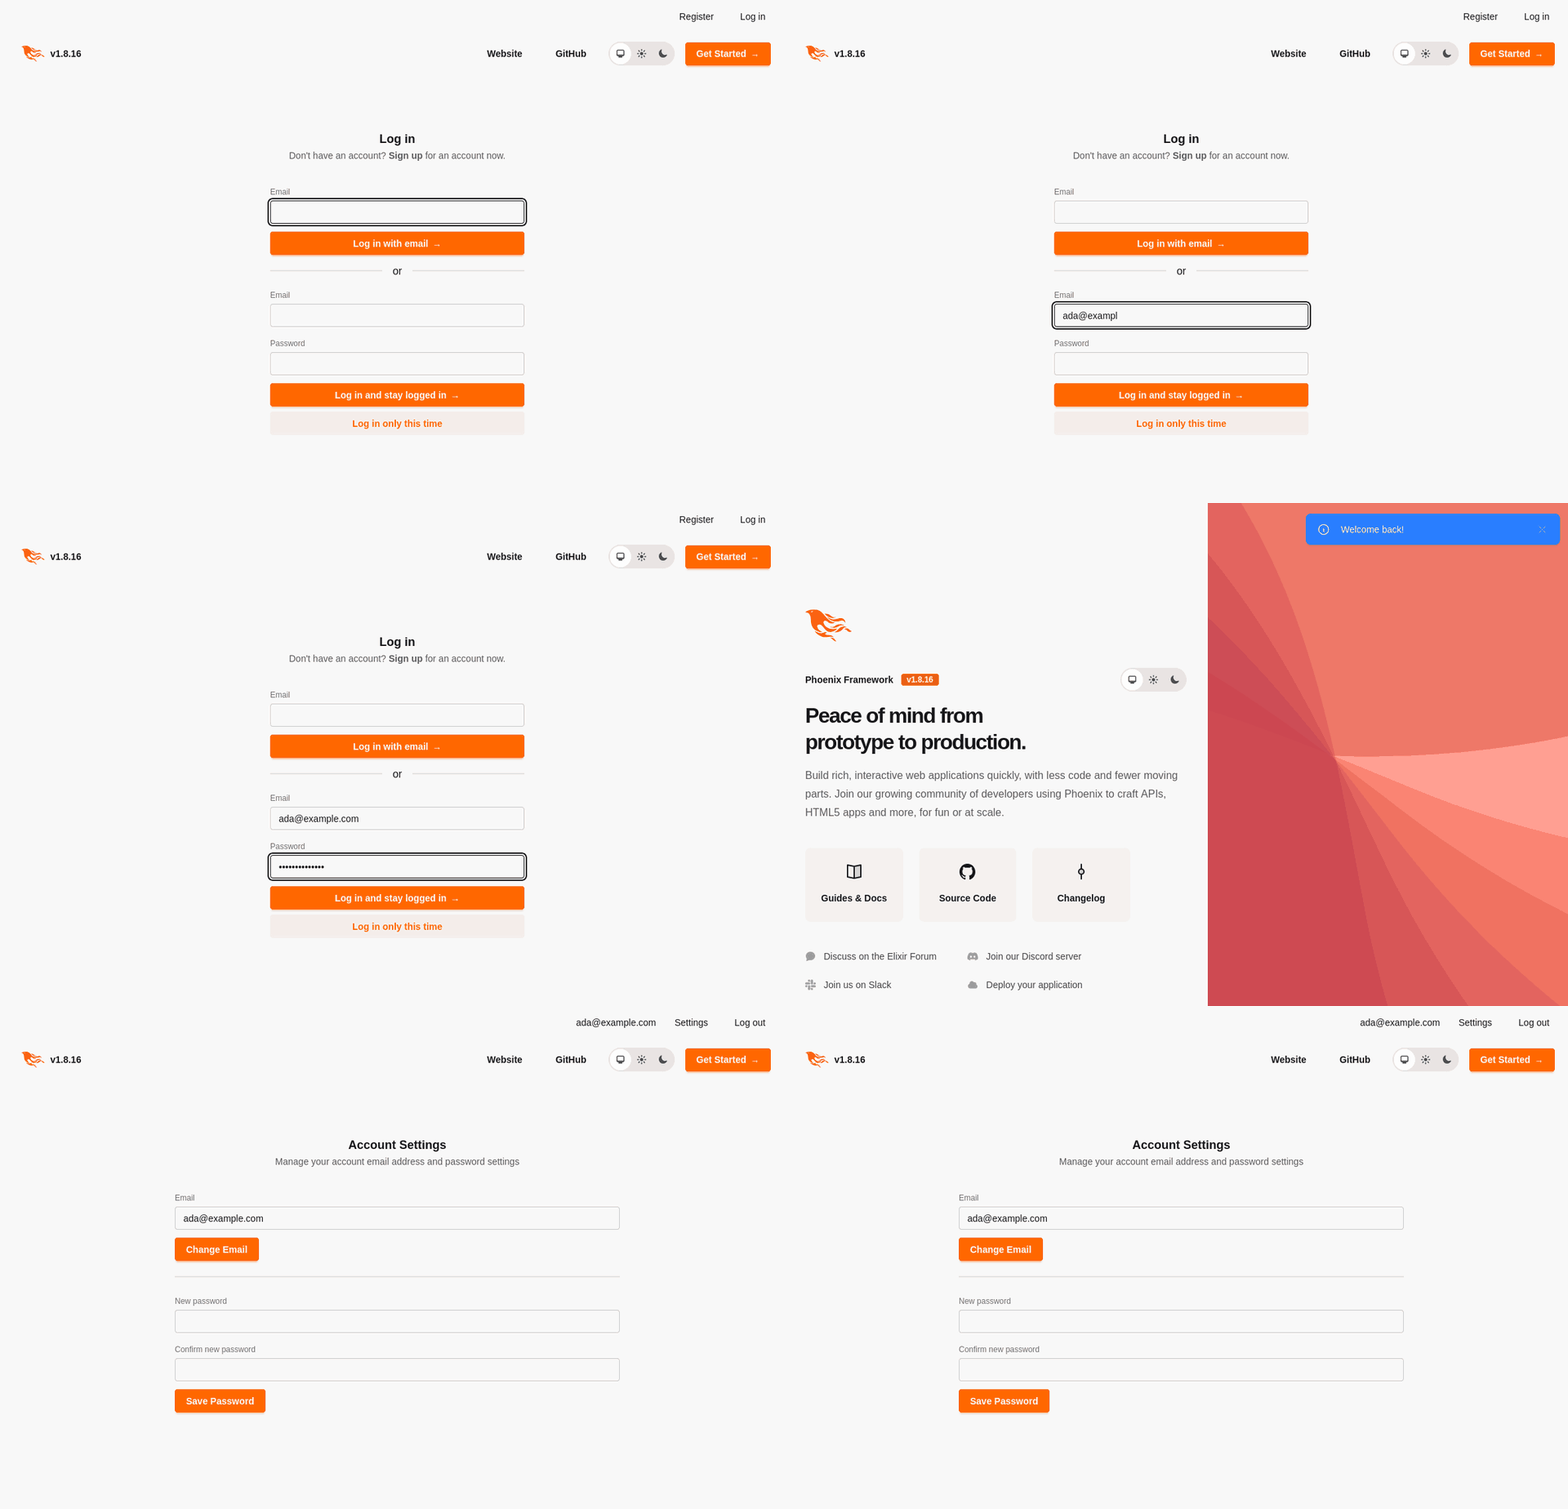
And this is the `run/1` it wrote to `loadtest/sign_in.exs`:
```elixir
def run(_vu) do
# A new visitor each time, or they'd still be signed in.
Stampede.HTTP.clear_cookies()
{:ok, %{url: "http://localhost:4000/users/log-in"} = view} =
Stampede.LiveView.connect("http://localhost:4000/users/log-in", cookies: true)
Process.sleep(5300)
_result =
Stampede.LiveView.submit(view, "submit_password", %{
"user" => %{"email" => "ada@example.com", "password" => "CHANGE_ME"}
})
Process.sleep(500)
{:ok, page} = Stampede.HTTP.get("http://localhost:4000/users/log-in", cookies: true)
# Put real values where it says CHANGE_ME, or this will be turned down.
{:ok, %{status: 302}} =
Stampede.HTTP.post("http://localhost:4000/users/log-in",
cookies: true,
form: %{
"_csrf_token" => Stampede.HTTP.csrf_token(page),
"user" => %{"email" => "ada@example.com", "password" => "CHANGE_ME"}
}
)
{:ok, %{status: 200}} = Stampede.HTTP.get("http://localhost:4000/", cookies: true)
Process.sleep(1500)
:ok = Stampede.LiveView.close(view)
{:ok, %{url: "http://localhost:4000/users/settings"} = view} =
Stampede.LiveView.connect("http://localhost:4000/users/settings", cookies: true)
:ok = Stampede.LiveView.close(view)
end
```
It has your clicks, forms, uploads, channels, navigation and pauses. Signing in
goes through the real form, with a fresh CSRF token and a session for each VU, and
the scenario checks that each page ends up where it did when you recorded it, so
a wrong password shows up as an error. Passwords, tokens and the like become
`"CHANGE_ME"`, in forms and in URLs, so they don't end up in a file you might
commit. I tried it in a real browser on a `phx.gen.auth` app, and the scenario it
wrote ran against the same app with no errors.
The [guide](https://stampede.hexdocs.pm/recording.html) has the details.
## Inside your app
A load test on its own tells you when your app got slow, not why. With
`--probe`, Stampede watches the app from the inside while the test runs, and
your app doesn't need any changes. It just needs a node name and a cookie, so
Stampede can reach it:
```console
$ elixir --name app@127.0.0.1 --cookie secret -S mix phx.server
```
```console
$ elixir --name loader@127.0.0.1 --cookie secret -S mix stampede.run loadtest/lobby.exs --probe app@127.0.0.1
```
Here's a small run against a fresh Phoenix app, with the channel's own timing
next to the one from outside:
```
metric count rate/s mean p50 p90 p95 p99 max
channel.push 2402 36.95 521µs 498µs 728µs 837µs 1.13ms 3.26ms
server.channel.event 2402 36.95 1µs 1µs 2µs 2µs 3µs 19µs
server
app@127.0.0.1 at its busiest: schedulers 1% busy, 0.21 GB of memory, 6,505 processes, run queue 0
```
You get how busy its schedulers were, its memory, processes and run queue
every second, charted in the dashboard and the HTML report, and its longest
message queues. Phoenix requests, channel events, LiveView events and Ecto
queries come back as `server.*` metrics, with percentiles, and you can set
thresholds on them like any other metric.
It watches your database too. With an Ecto repo, you get how long queries
waited for a connection from the pool, every second. With Postgres, the probe
opens one connection of its own, outside your pool, and reads Postgres's own
commits, rows written and read, connections and what its sessions were waiting
on. When a `--find-limit` step fails, the verdict puts that together and says
why. Here it is on my laptop, with Postgres held to a fifth of a CPU so that it
would be the limit:
```
limit
Held 250 VUs. At 350 VUs, iteration.errors count was 64, over 0. Queries waited up to
171.94ms for one of the database pool's 2 connections. Postgres was mostly busy running
queries. The app's schedulers were only 16% busy, so the database was the limit, not the app.
```
Here's what the probe saw on the way to 600,000 users, with 1.2 million
processes on 4 cores:
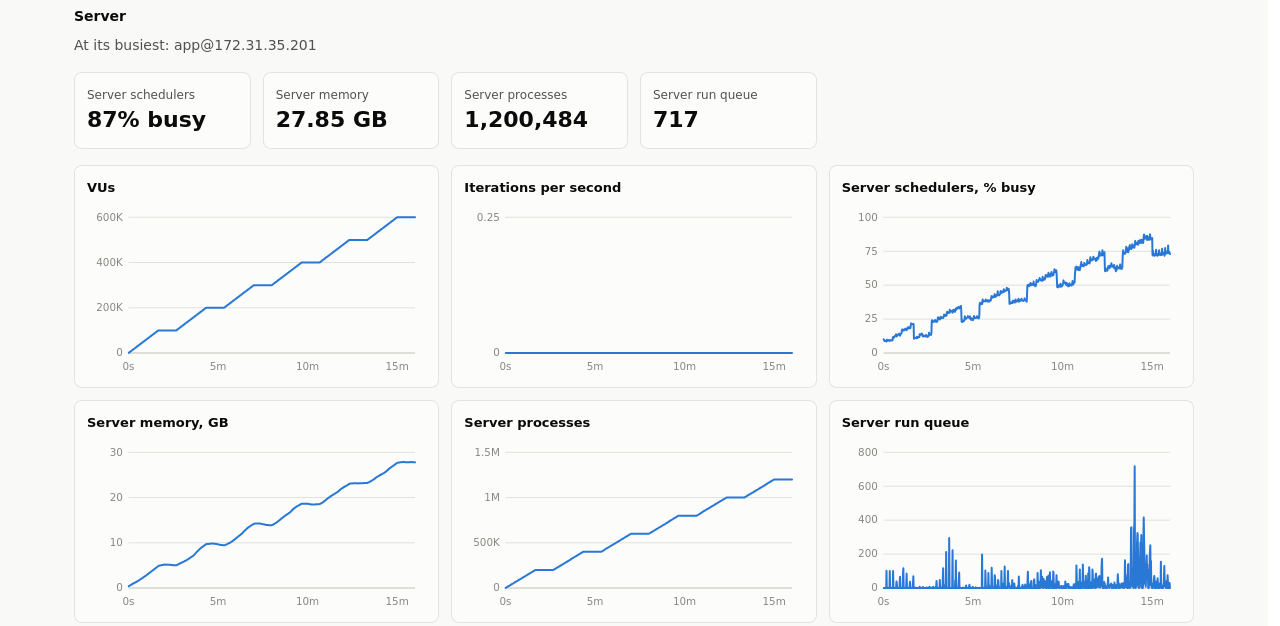
A small agent runs on the app's node during the test. It stops by itself if
the test goes away, and its code is removed afterwards. It costs a little:
in that test, the server's CPU was about 6 points higher with the probe on.
The [guide](https://stampede.hexdocs.pm/probe.html) covers connecting to a real deployment, and how
to read what it finds.
## Phoenix Channels
`Stampede.Channels` does what the JavaScript client does:
* `connect/2` with params, headers and either serializer (`"2.0.0"` or `"1.0.0"`)
* `join/4`, `push/5` and `leave/3`, which wait for the reply
* `cast/4` for events the channel doesn't reply to
* `await/4` for pushes and broadcasts from the server, with an optional
`:match` function to pick one out of many
* heartbeats, every 30 seconds by default
* binary payloads, as `{:binary, data}`, with the `"2.0.0"` serializer
* a `:serializer` option for servers that add message types of their own,
such as custom binary frames
It records `ws.connect`, `ws.disconnects`, `channel.join`, `channel.push`,
`channel.leave` and `channel.messages`, plus an `.errors` counter for each
kind of request. A push to a channel that crashes fails right away with
`{:error, :channel_crashed}`, instead of waiting for its timeout.
[Phoenix Presence](https://stampede.hexdocs.pm/presence.html) and
[Absinthe subscriptions](https://stampede.hexdocs.pm/absinthe.html) both run over channels, and
each has a guide.
## LiveView
`Stampede.LiveView` loads the page, then joins the LiveView on it with the
page's CSRF token and cookies, just like a browser:
```elixir
@impl true
def run(_vu) do
{:ok, view} = Stampede.LiveView.connect("http://localhost:4000/posts/new")
{:ok, _reply} = Stampede.LiveView.change(view, "validate", %{"post" => %{"title" => "Hi"}})
{:ok, _reply} = Stampede.LiveView.submit(view, "save", %{"post" => %{"title" => "Hi there"}})
{:ok, _reply} = Stampede.LiveView.click(view, "like", %{"id" => "1"})
{:ok, _view} = Stampede.LiveView.navigate(view, "/posts")
end
```
`click/4`, `change/4` and `submit/4` send what `phx-click`, `phx-change` and
`phx-submit` would, and give back whatever `handle_event/3` replied. Pass
`target: 1` to talk to a component, like `phx-target` does. `await/2` waits
for updates the LiveView pushes on its own.
`patch/3` and `navigate/3` work like `<.link patch>` and `<.link navigate>`,
reusing the socket when LiveView allows it. If an event makes the LiveView
navigate, you get `{:error, {:live_redirect, %{"to" => to}}}` back, the same
as with `Phoenix.LiveViewTest`, and `navigate/3` will follow it.
`upload/4` sends files to a `live_file_input`, in chunks over the same
socket, so you can submit the form with them afterwards:
```elixir
photo = :crypto.strong_rand_bytes(200_000)
:ok = Stampede.LiveView.upload(view, "avatar", [%{name: "me.jpg", content: photo}])
{:ok, _reply} = Stampede.LiveView.submit(view, "save", %{"user" => %{"name" => "jo"}})
```
Pages behind a login work too. `connect/2` follows redirects and keeps the
cookies they set, so a route that signs in a test user and redirects is
enough. Or go through the real form, since `Stampede.HTTP` keeps cookies with
`cookies: true` and `Stampede.HTTP.csrf_token/1` finds the page's token. The
[login guide](https://stampede.hexdocs.pm/login.html) walks through both. LiveView
runs record `live.page`, `live.join`, `live.event`, `live.patch`,
`live.navigate` and `live.upload`.
## HTTP
`Stampede.HTTP` records requests as `http.request`, and counts transport
errors and responses of 400 or more under `http.request.errors`:
```elixir
{:ok, %{status: 200, body: body}} = Stampede.HTTP.get("http://localhost:4000/api/posts")
{:ok, %{status: 201}} = Stampede.HTTP.post("http://localhost:4000/api/posts", json: %{title: "Hi"})
```
Each VU keeps its connections open between requests, like a browser, and
reconnects when the server has closed one. On my laptop, against a Phoenix
app on the same machine, 2,000 GET requests a second for 10 seconds held
their rate with a p99 of 1.56ms.
## Plain WebSockets
For servers that don't use Phoenix Channels, like a `WebSock` handler or a
GraphQL subscription endpoint, there's `Stampede.WebSocket`:
```elixir
{:ok, ws} = Stampede.WebSocket.connect("ws://localhost:4000/ws")
:ok = Stampede.WebSocket.send(ws, JSON.encode!(%{subscribe: "prices"}))
{:ok, {:text, text}} = Stampede.WebSocket.await(ws, match: &match?({:text, "{\"price\"" <> _}, &1))
```
It answers pings and holds on to the frames it receives until `await/2`
reads them, even after the server has closed the connection. It records
`ws.connect`, `ws.disconnects`, `ws.messages` and `ws.messages.sent`.
## AI chat APIs
`Stampede.LLM` load tests anything with an OpenAI-style chat API, such as
Ollama, vLLM or llama.cpp, written in any language:
```elixir
{:ok, reply} =
Stampede.LLM.chat("http://localhost:11434/v1",
model: "qwen2.5:0.5b",
messages: [%{role: "user", content: "Why is the sky blue?"}],
max_tokens: 128
)
```
It records time to first token (`llm.ttft`), the gaps between tokens
(`llm.itl`), time per token (`llm.tpot`), the whole request (`llm.request`)
and tokens per second (`llm.tokens.output`), and the dashboard and HTML report
show them. `--find-limit` then tells you how many people can chat at once. On
8 CPU cores, Ollama held 6 with a small model. Tokens never slowed down, but
the first token did, because Ollama answers one person at a time by default.
Setting `OLLAMA_NUM_PARALLEL=4` doubled it to 12.
The [guide](https://stampede.hexdocs.pm/llm.html) has a one-file script that needs no Mix project,
how to use realistic prompts, and how to read the result. `Stampede.SSE` is
underneath, for any other server that streams Server-Sent Events.
## Scenarios
A scenario is a module that implements `Stampede.Scenario`. Only `run/1` is
required:
* `run/1` is one iteration of a VU. It gets a `Stampede.VU` with the VU's
`id`, its `iteration` count and the `data` returned by `setup/1`.
* `options/0` returns the default options of the run.
* `setup/1` runs once, before any VU starts. It's the place to create
accounts or sign tokens that every VU needs.
When an iteration raises, the error is counted under `iteration.errors` and
listed in the summary, and the VU simply starts its next iteration. Sockets
opened during an iteration are closed when it ends, so nothing leaks from one
iteration to the next.
## VUs or a rate
There are two ways to apply load: keep a number of VUs busy, or start
iterations at a fixed rate.
`stages` is a list of `{duration, target}` tuples, each moving the number of
VUs in a straight line to its target. `vus: 100, duration: [minute: 1]` just
holds 100 VUs for a minute. Durations are milliseconds, or anything
`Kernel.to_timeout/1` takes, like `[second: 30]`.
The catch with VUs is that each one waits for its last iteration to finish
before starting the next. When your server slows down, the load quietly eases
off with it, and real users don't do that. `rate` keeps starting iterations
on schedule, however long they take:
```elixir
[rate: 200, duration: [minute: 5], max_vus: 1_000]
[rate_stages: [{[minute: 1], 500}, {[minute: 5], 500}]]
```
VUs are started as needed and reused, keeping their connections. `max_vus`
caps how many iterations can be in flight, and the ones that can't start are
counted as `iterations.dropped`.
On the command line, `--vus 100` or `--rate 200` with `--duration 1m`
override whatever the scenario says.
VUs that aren't needed anymore, during a ramp down or at the end, are stopped
right away. Set `graceful_stop: [second: 30]` to let them finish their
current iteration first, so it gets recorded instead of cut off.
## Mixing kinds of traffic
Real traffic is rarely one kind of user. Usually lots of people are reading
while a few are writing. `--parallel` runs every scenario you give it at the
same time, each with its own load and thresholds:
```console
$ mix stampede.run loadtest/reading.exs loadtest/posting.exs --parallel
```
From code, it's `Stampede.run_parallel([Reading, Posting])`, which returns
one result per scenario.
## Checks and thresholds
Checks are assertions that don't stop the iteration when they fail:
```elixir
{:ok, response} = Stampede.HTTP.get("http://localhost:4000/api/posts")
Stampede.check("status is 200", response.status == 200)
```
Thresholds are the limits a run has to stay within to pass:
```elixir
thresholds: [
{"channel.join", p95: 250, max: 2_000},
{"status is 200", failed_rate: 0.01},
{"iteration.errors", count: 0}
]
```
Timings have `min`, `mean`, `p50`, `p90`, `p95`, `p99` and `max`, in
milliseconds. Checks have `failed` and `failed_rate`, and every metric has
`count` and `rate`, per second. Percentiles stay within 1% of the exact
value, however many samples a run collects.
## Metrics
Every scenario records `iteration`, `iteration.errors`, `iterations.dropped`
and `vu.crashes`, and each client below records its own. Add yours with
`Stampede.measure/2`, `Stampede.record/3`, `Stampede.increment/2` and
`Stampede.check/2`. Timing a broadcast round trip, for example:
```elixir
Stampede.measure("broadcast.roundtrip", fn ->
:ok = Stampede.Channels.cast(socket, "room:lobby", "shout", %{from: vu.id})
{:ok, _payload} = Stampede.Channels.await(socket, "room:lobby", "shout", match: &(&1["from"] == vu.id))
end)
```
## In your test suite
If you'd rather keep load tests with your other tests, `Stampede.ExUnit`
fails a test when a threshold fails, with the run's summary in the failure
message:
```elixir
Code.require_file("../loadtest/lobby.exs", __DIR__)
defmodule MyApp.LoadTest do
use ExUnit.Case
import Stampede.ExUnit
@moduletag :load
test "the lobby holds 200 users" do
assert_load(MyApp.Load.Lobby, vus: 200, duration: [second: 30])
end
end
```
Put `ExUnit.start(exclude: [:load])` in `test/test_helper.exs`, so they only
run with `mix test --only load`.
## Results
`Stampede.run/2` returns a `Stampede.Result` with a summary of every metric
and a timeline of each second of the run, which is handy for spotting when
latency started to climb during a ramp. `--out results.json` saves all of
it as JSON.
`--html report.html` writes the same charts as the dashboard into a single
file with nothing else to load, so CI can keep it as an artifact.
To catch regressions, compare two runs:
```console
$ mix stampede.run loadtest/api.exs --out main.json
$ git switch my-branch
$ mix stampede.run loadtest/api.exs --out branch.json
$ mix stampede.compare main.json branch.json --max-regression 10
```
It shows how the p50, p95 and p99 of every timing changed, and exits with
status 1 if one got more than 10% slower.
There are also `:telemetry` events for every timing, counter and check, and
for each second of a run, if you want the numbers in your own metrics system
while a test runs. The `Stampede` docs list them.
## Spreading the load
One machine will run out of CPU or ports long before a decent Phoenix server
runs out of room. Start a node on each extra machine, from the same project,
and hand them to the task:
```console
$ iex --sname worker --cookie load -S mix
$ elixir --sname loader --cookie load -S mix stampede.run loadtest/lobby.exs --nodes worker@host
```
VUs and rates are split evenly, and the metrics merged as if it all ran on
one machine. From code, pass `nodes: [node() | Node.list()]`. The
[guide](https://stampede.hexdocs.pm/distributed.html) covers the limits of a single machine and
running across a network.
## Without a Mix project
A load test can also be a plain script:
```elixir
Mix.install([{:stampede, "~> 1.4"}])
defmodule Lobby do
use Stampede.Scenario
@impl true
def run(_vu) do
{:ok, socket} = Stampede.Channels.connect("ws://localhost:4000/socket")
{:ok, _reply} = Stampede.Channels.join(socket, "room:lobby")
Process.sleep(1_000)
end
end
result = Stampede.run(Lobby, vus: 100, duration: [minute: 1], progress: true)
IO.puts(Stampede.Reporter.format(result))
System.halt(if result.passed?, do: 0, else: 1)
```
## In Livebook
[](https://livebook.dev/run?url=https%3A%2F%2Fgithub.com%2Fmandar1045%2Fstampede%2Fblob%2Fmain%2Fnotebooks%2Fload_test.livemd)
Add Stampede and Kino to a notebook, and pick **Load test** from the
**+ Smart** menu:
```elixir
Mix.install([{:stampede, "~> 1.4"}, {:kino, "~> 0.14"}])
```
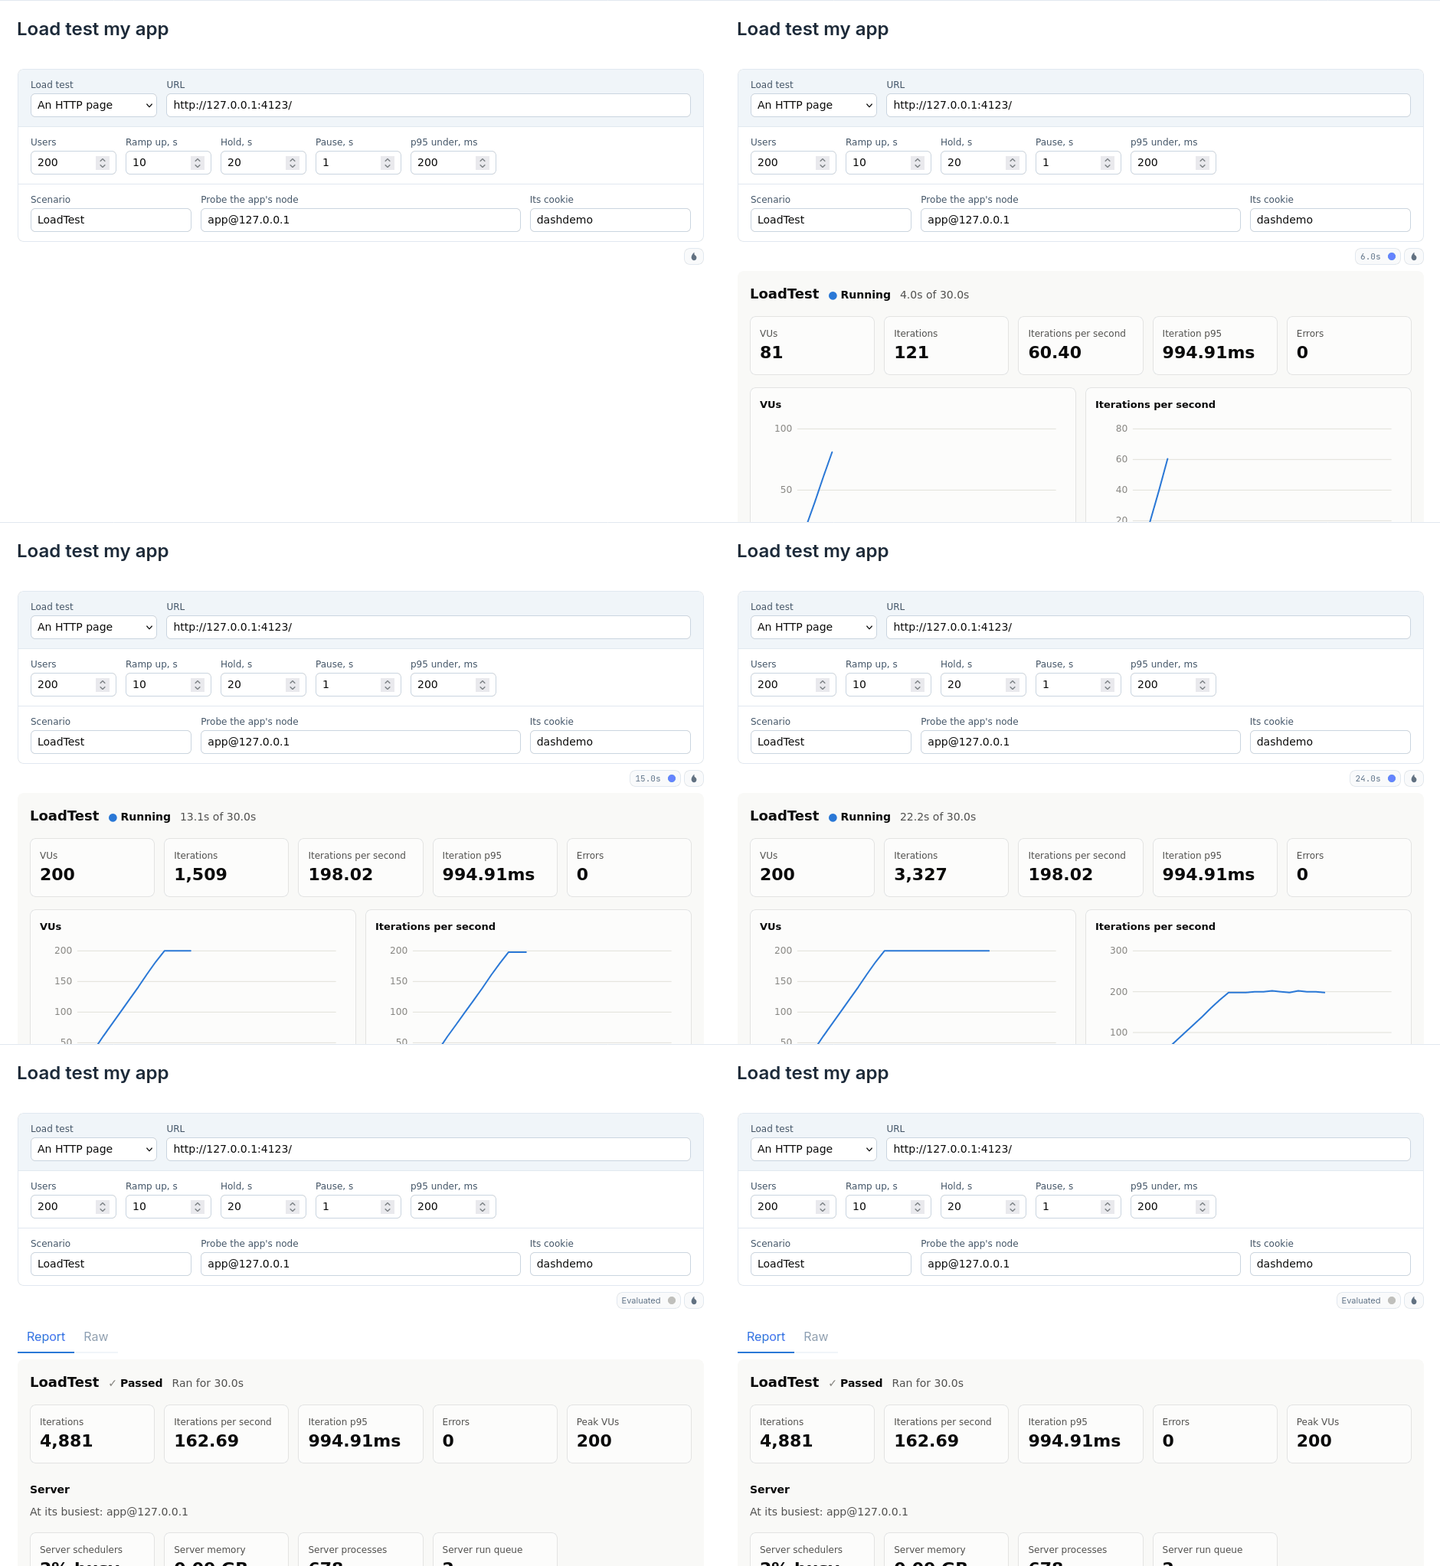
You fill in what to load test, a page, a LiveView, a channel or an AI chat
API, and how many users, and it writes the scenario for you. The run shows in
the notebook while it goes, like the dashboard, and the result shows as the
report. Give it your app's node and cookie, and you get the app's own numbers
too. The badge above opens a notebook that starts a small server to try it on.
From code, `Stampede.Kino.run/2` does the same for any scenario, and any
`Stampede.Result` shows as the report.
## Guides
* [Pages behind a login](https://stampede.hexdocs.pm/login.html)
* [Phoenix Presence](https://stampede.hexdocs.pm/presence.html)
* [GraphQL subscriptions with Absinthe](https://stampede.hexdocs.pm/absinthe.html)
* [Load tests in CI](https://stampede.hexdocs.pm/ci.html)
* [Spreading the load over machines](https://stampede.hexdocs.pm/distributed.html)
* [Load testing AI chat APIs](https://stampede.hexdocs.pm/llm.html)
* [Seeing inside your app](https://stampede.hexdocs.pm/probe.html)
* [Watching a run in Prometheus and Grafana](https://stampede.hexdocs.pm/prometheus.html)
* [Recording a session](https://stampede.hexdocs.pm/recording.html)
* [Case study: Supabase Realtime](https://stampede.hexdocs.pm/supabase_realtime.html)
## Why not k6, Locust or Artillery?
They're good tools, especially for plain HTTP APIs. For Phoenix, though, they
see a channel as just another WebSocket, so you end up writing the protocol
yourself: joins, refs, replies and heartbeats. LiveView is harder still,
since the socket needs tokens from a page load before it can even connect.
Stampede handles all of that, and because scenarios are Elixir, you can
reuse your own modules and test data in them.
## Status
Stampede is young. I've used it to load test a real-world Phoenix server
(there's a [case study](https://stampede.hexdocs.pm/supabase_realtime.html) with the numbers), and its
test suite runs real load tests against a Phoenix app on every change. Still,
expect rough edges, and please tell me when you hit one.
## Roadmap
What I'm working on next:
* LiveView at the same scale as Channels
* A command line tool that doesn't need Elixir installed
* More protocols: Socket.IO and GraphQL over WebSocket
If one of these would help you, or something else is missing, say so in
[Discussions](https://github.com/mandar1045/stampede/discussions).
## Contributing
Bug reports go in the issues, questions and ideas in
[Discussions](https://github.com/mandar1045/stampede/discussions). If you'd
like to work on Stampede itself, [CONTRIBUTING.md](https://github.com/mandar1045/stampede/blob/main/CONTRIBUTING.md) explains
how to get set up.
## License
Copyright 2026 Mandar Joshi
Licensed under the Apache License, Version 2.0, found in the LICENSE file.