Current section
Files
Jump to
Current section
Files
benchee_csv
README.md
README.md
# BencheeCSV [](https://hex.pm/packages/benchee_csv)[](https://hexdocs.pm/benchee_csv/)[](https://travis-ci.org/PragTob/benchee_csv)
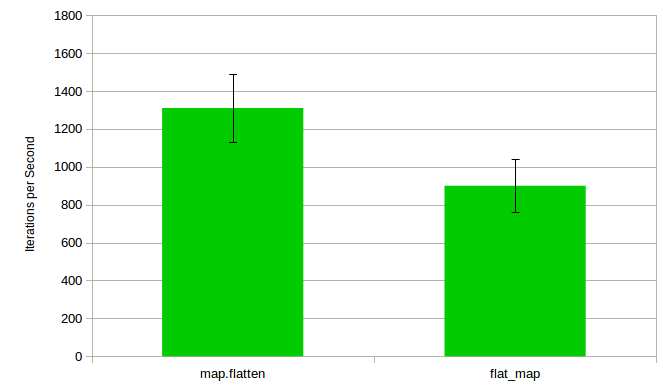
Formatter for [benchee](https://github.com/PragTob/benchee) to turn the statistics output into a CSV file. This can then be used in the Spreadsheet tool of your choice to generate graphs to your liking.
These might then look like this one (quickly generated with LibreOffice from the output of the sample):
## Installation
Add benchee_csv to your list of dependencies in `mix.exs`:
```elixir
def deps do
[{:benchee_csv, "~> 0.1"}]
end
```
Afterwards, run `mix deps.get` to install it.
## Usage
For now use the more verbose API of Benchee and when it comes to formatting just use `Benchee.Formatters.CSV.format` and then write it to a file. Here is an example:
```elixir
file = File.open!("test.csv", [:write])
list = Enum.to_list(1..10_000)
map_fun = fn(i) -> [i, i * i] end
Benchee.init
|> Benchee.benchmark("flat_map", fn -> Enum.flat_map(list, map_fun) end)
|> Benchee.benchmark("map.flatten",
fn -> list |> Enum.map(map_fun) |> List.flatten end)
|> Benchee.measure
|> Benchee.statistics
|> Benchee.Formatters.CSV.format
|> Enum.each(fn(row) -> IO.write(file, row) end)
```