Packages
prometheus
4.2.0
6.1.3
6.1.2
6.1.1
6.1.0
6.0.3
6.0.2
6.0.1
6.0.0
5.1.1
5.1.0
5.0.0
4.13.0
retired
4.12.0
4.11.0
4.10.0
4.9.1
4.9.0
4.8.2
4.8.1
4.8.0
4.6.0
4.5.0
4.4.1
4.4.0
4.3.0
4.2.2
4.2.0
4.1.0
4.0.1
4.0.0
3.5.1
3.5.0
3.4.6
3.4.5
3.4.4
3.4.3
3.4.2
3.4.1
3.4.0
3.3.2
3.3.1
3.3.0
3.2.3
3.2.2
3.2.1
3.1.1
3.1.0
3.0.1
3.0.0
3.0.0-rc1
3.0.0-alpha9
3.0.0-alpha8
3.0.0-alpha7
3.0.0-alpha6
3.0.0-alpha5
3.0.0-alpha4
3.0.0-alpha3
3.0.0-alpha2
3.0.0-alpha10
3.0.0-alpha1
2.2.0
2.1.0
2.0.0
1.7.0
1.6.0
1.5.0
1.0.2
1.0.1
1.0.0
0.2.0
0.1.3
0.1.2
0.1.1
0.1.0
Prometheus.io client in Erlang
Current section
Files
Jump to
Current section
Files
prometheus
README.md
README.md
# Prometheus.io client for Erlang #
Copyright (c) 2016,2017 Ilya Khaprov <<i.khaprov@gmail.com>>.
__Version:__ 4.2.0
[](https://hex.pm/packages/prometheus)
[](https://hex.pm/packages/prometheus)
[](https://travis-ci.org/deadtrickster/prometheus.erl)
[](https://coveralls.io/github/deadtrickster/prometheus.erl?branch=master)
[Prometheus.io](https://prometheus.io) monitoring system and time series database client in Erlang.
- IRC: #erlang on Freenode;
- [Slack](https://elixir-slackin.herokuapp.com/): #prometheus channel - [Browser](https://elixir-lang.slack.com/messages/prometheus) or App(slack://elixir-lang.slack.com/messages/prometheus).
## Integrations
- [Cowboy1/2 Exporters and Cowboy2 instrumenter](https://hex.pm/packages/prometheus_cowboy)
- [Opencensus.io integration](https://github.com/deadtrickster/opencensus-erlang-prometheus)
- [Ecto Instrumenter](https://hex.pm/packages/prometheus_ecto)
- [Elixir client](https://github.com/deadtrickster/prometheus.ex)
- [Elixir plugs Instrumenters and Exporter](https://hex.pm/packages/prometheus_plugs)
- [Extatus - App to report metrics to Prometheus from Elixir GenServers](https://github.com/gmtprime/extatus)
- [Fuse plugin](https://github.com/jlouis/fuse#fuse_stats_prometheus)
- [Inets HTTPD Exporter](https://github.com/deadtrickster/prometheus_httpd)
- [OS process info Collector](https://hex.pm/packages/prometheus_process_collector) (linux, freebsd, macos)
- [Phoenix Instrumenter](https://hex.pm/packages/prometheus_phoenix)
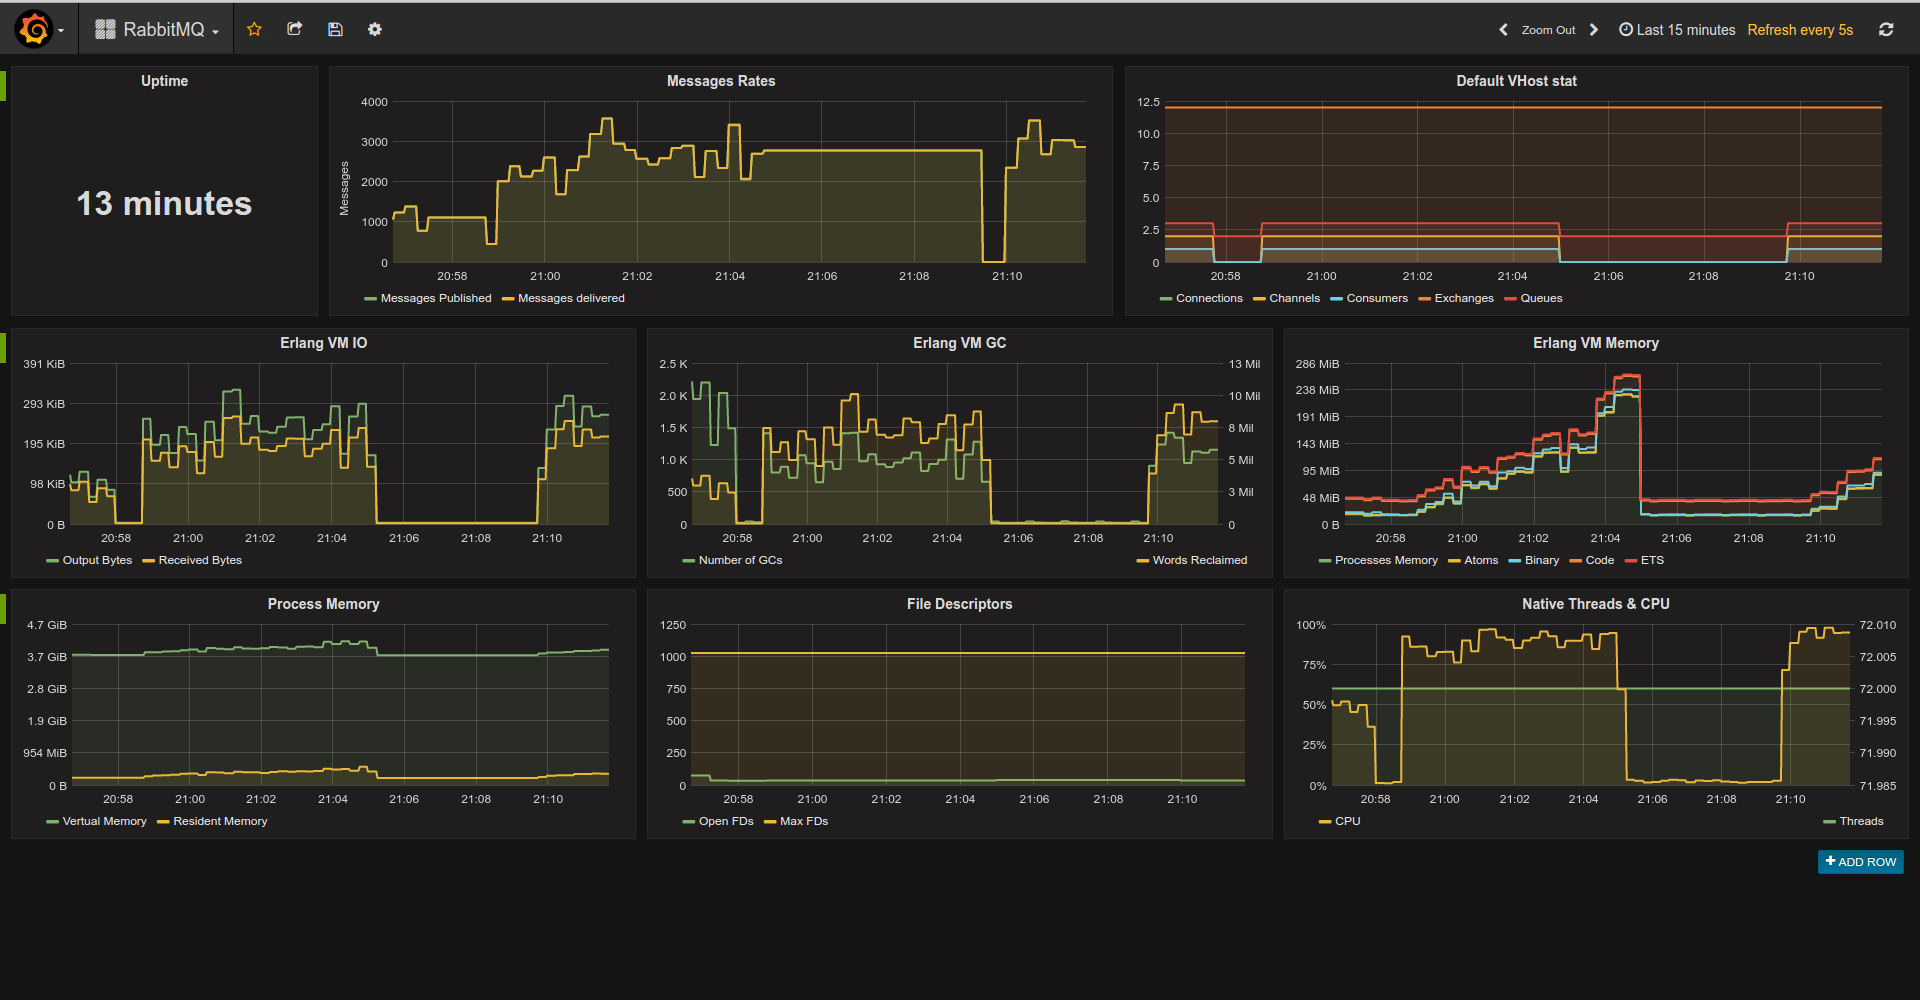
- [RabbitMQ Exporter](https://github.com/deadtrickster/prometheus_rabbitmq_exporter).
## Dashboards
- [Beam Dashboards](https://github.com/deadtrickster/beam-dashboards).
## Blogs
- [Install, Monitor Erlang Releases in Kubernetes with Helm + Prometheus](https://spacetimeinsight.com/installing-monitoring-erlang-releases-kubernetes-helm-prometheus/)
- [Monitoring Elixir apps in 2016: Prometheus and Grafana](https://aldusleaf.org/monitoring-elixir-apps-in-2016-prometheus-and-grafana/)
- [A Simple Erlang Application, with Prometheus](http://markbucciarelli.com/2016-11-23_a_simple_erlang_application_with_prometheus.html).
## Erlang VM & OTP Collectors
- [Memory Collector](https://github.com/deadtrickster/prometheus.erl/blob/master/doc/prometheus_vm_memory_collector.md)
- [Mnesia Collector](https://github.com/deadtrickster/prometheus.erl/blob/master/doc/prometheus_mnesia_collector.md)
- [Statistics Collector](https://github.com/deadtrickster/prometheus.erl/blob/master/doc/prometheus_vm_statistics_collector.md)
- [System Information Collector](https://github.com/deadtrickster/prometheus.erl/blob/master/doc/prometheus_vm_system_info_collector.md).
## Compatibility
### OTP versions
Version 3.x works on OTP18+. For older version (oldest tested is R16B03) please use
[3.x-pre18 branch](https://github.com/deadtrickster/prometheus.erl/tree/3.x-pre18).
3.x-pre18 will work on all OTP releases starting from R16B03 and its beam will recompile itself to accommodate.
For example, this branch is used by [RabbitMQ Exporter](https://github.com/deadtrickster/prometheus_rabbitmq_exporter) 3.6.x
that should be compatible with all versions starting from R16B03.
### Build tools
Rebar3 and rebar2 are supported.
## Example Console Session
Run shell with compiled and loaded app:
```erlang-repl
$ rebar3 shell
```
Start prometheus app:
```erlang-repl
prometheus:start().
```
Register metrics:
```erlang
prometheus_gauge:new([{name, pool_size}, {help, "MongoDB Connections pool size"}]),
prometheus_counter:new([{name, http_requests_total}, {help, "Http request count"}]).
prometheus_summary:new([{name, orders}, {help, "Track orders count/total sum"}]).
prometheus_histogram:new([{name, http_request_duration_milliseconds},
{labels, [method]},
{buckets, [100, 300, 500, 750, 1000]},
{help, "Http Request execution time"}]).
```
Use metrics:
```erlang
prometheus_gauge:set(pool_size, 365),
prometheus_counter:inc(http_requests_total).
prometheus_summary:observe(orders, 10).
prometheus_summary:observe(orders, 15).
prometheus_histogram:observe(http_request_duration_milliseconds, [get], 95).
prometheus_histogram:observe(http_request_duration_milliseconds, [get], 100).
prometheus_histogram:observe(http_request_duration_milliseconds, [get], 102).
prometheus_histogram:observe(http_request_duration_milliseconds, [get], 150).
prometheus_histogram:observe(http_request_duration_milliseconds, [get], 250).
prometheus_histogram:observe(http_request_duration_milliseconds, [get], 75).
prometheus_histogram:observe(http_request_duration_milliseconds, [get], 350).
prometheus_histogram:observe(http_request_duration_milliseconds, [get], 550).
prometheus_histogram:observe(http_request_duration_milliseconds, [get], 950).
prometheus_histogram:observe(http_request_duration_milliseconds, [post], 500),
prometheus_histogram:observe(http_request_duration_milliseconds, [post], 150).
prometheus_histogram:observe(http_request_duration_milliseconds, [post], 450).
prometheus_histogram:observe(http_request_duration_milliseconds, [post], 850).
prometheus_histogram:observe(http_request_duration_milliseconds, [post], 750).
prometheus_histogram:observe(http_request_duration_milliseconds, [post], 1650).
```
Export metrics as text:
```erlang
io:format(prometheus_text_format:format()).
```
->
```
# TYPE http_requests_total counter
# HELP http_requests_total Http request count
http_requests_total 2
# TYPE pool_size gauge
# HELP pool_size MongoDB Connections pool size
pool_size 365
# TYPE orders summary
# HELP orders Track orders count/total sum
orders_count 4
orders_sum 50
# TYPE http_request_duration_milliseconds histogram
# HELP http_request_duration_milliseconds Http Request execution time
http_request_duration_milliseconds_bucket{method="post",le="100"} 0
http_request_duration_milliseconds_bucket{method="post",le="300"} 1
http_request_duration_milliseconds_bucket{method="post",le="500"} 3
http_request_duration_milliseconds_bucket{method="post",le="750"} 4
http_request_duration_milliseconds_bucket{method="post",le="1000"} 5
http_request_duration_milliseconds_bucket{method="post",le="+Inf"} 6
http_request_duration_milliseconds_count{method="post"} 6
http_request_duration_milliseconds_sum{method="post"} 4350
http_request_duration_milliseconds_bucket{method="get",le="100"} 3
http_request_duration_milliseconds_bucket{method="get",le="300"} 6
http_request_duration_milliseconds_bucket{method="get",le="500"} 7
http_request_duration_milliseconds_bucket{method="get",le="750"} 8
http_request_duration_milliseconds_bucket{method="get",le="1000"} 9
http_request_duration_milliseconds_bucket{method="get",le="+Inf"} 9
http_request_duration_milliseconds_count{method="get"} 9
http_request_duration_milliseconds_sum{method="get"} 2622
```
## API
API can be grouped like this:
### Standard Metrics & Registry
- [`prometheus_counter`](https://github.com/deadtrickster/prometheus.erl/blob/master/doc/prometheus_counter.md) - counter metric, to track counts of events or running totals;
- [`prometheus_gauge`](https://github.com/deadtrickster/prometheus.erl/blob/master/doc/prometheus_gauge.md) - gauge metric, to report instantaneous values;
- [`prometheus_histogram`](https://github.com/deadtrickster/prometheus.erl/blob/master/doc/prometheus_histogram.md) - histogram metric, to track distributions of events;
- [`prometheus_summary`](https://github.com/deadtrickster/prometheus.erl/blob/master/doc/prometheus_summary.md) - summary metric, to track the size of events;
- [`prometheus_boolean`](https://github.com/deadtrickster/prometheus.erl/blob/master/doc/prometheus_boolean.md) - boolean metric, to track the state of something;
- [`prometheus_registry`](https://github.com/deadtrickster/prometheus.erl/blob/master/doc/prometheus_registry.md) - working with Prometheus registries.
All metrics created via `new/1` or `declare/1`. The difference is that `new/1` actually wants metric to be
new and raises `{mf_already_exists, {Registry, Name}, Message}` error if it isn't.
Both `new/1` and `declare/1` accept options as [proplist](http://erlang.org/doc/man/proplists.html).
Common options are:
- name - metric name, can be an atom or a string (required);
- help - metric help, string (required);
- labels - metric labels, label can be an atom or a string (default is []);
- registry - Prometheus registry for the metric, can be any term. (default is default)
Histogram also accepts `buckets` option. Please refer to respective modules docs for the more information.
### Exposition Formats
- [`prometheus_text_format`](https://github.com/deadtrickster/prometheus.erl/blob/master/doc/prometheus_text_format.md) - renders metrics for a given registry (default is `default`) in text format;
- [`prometheus_protobuf_format`](https://github.com/deadtrickster/prometheus.erl/blob/master/doc/prometheus_protobuf_format.md) - renders metrics for a given registry (default is `default`) in protobuf v2 format.
### General Helpers
- [`prometheus_buckets`](https://github.com/deadtrickster/prometheus.erl/blob/master/doc/prometheus_buckets.md) - linear or exponential bucket generators;
- [`prometheus_http`](https://github.com/deadtrickster/prometheus.erl/blob/master/doc/prometheus_http.md) - helpers for HTTP instrumenters;
- [`prometheus_mnesia`](https://github.com/deadtrickster/prometheus.erl/blob/master/doc/prometheus_mnesia.md) - Mnesia instrumentation helpers.
### Advanced
You will need these modules only if you're writing custom collector for app/lib that can't be instrumented directly.
- [`prometheus_collector`](https://github.com/deadtrickster/prometheus.erl/blob/master/doc/prometheus_collector.md) - common interface for collectors;
- [`prometheus_format`](https://github.com/deadtrickster/prometheus.erl/blob/master/doc/prometheus_format.md) - common interface for exposition formats;
- [`prometheus_model_helpers`](https://github.com/deadtrickster/prometheus.erl/blob/master/doc/prometheus_model_helpers.md) - provides API for working with underlying Prometheus models.
You'll use that if you want to create custom collector.
## Build
```
$ rebar3 compile
```
## Configuration
Prometheus.erl supports standard Erlang app configuration.
- `collectors` - List of custom collectors modules to be registered automatically. If undefined list of all modules implementing `prometheus_collector` behaviour will be used.
- `default_metrics` - List of metrics to be registered during app startup. Metric format: `{Type, Spec}` where `Type` is a metric type (counter, gauge, etc), `Spec` is a list to be passed to `Metric:declare/1`. Deprecated format `{Registry, Metric, Spec}` also supported.
Collectors config also supports "alias" option `default`. When used these collectors will be registered:
<pre>
prometheus_boolean,
prometheus_counter,
prometheus_gauge,
prometheus_histogram,
prometheus_mnesia_collector,
prometheus_summary,
prometheus_vm_memory_collector,
prometheus_vm_statistics_collector,
prometheus_vm_system_info_collector
</pre>
## Collectors & Exporters Conventions
### Configuration
All 3d-party libraries should be configured via `prometheus` app env.
Exproters are responsible for maintianing scrape endpoint.
Exporters usually tightly coupled with web server and are singletons. They should understand these keys:
- `path` - url for scraping;
- `format` - scrape format as module name i.e. `prometheus_text_format` or `prometheus_protobuf_format`.
Exporter-specific options should be under `<exporter_name>_exporter` for erlang or `<Exporter_name>Exporter` for Elixir i.e. `PlugsExporter` or `elli_exporter`
Collectors collect integration specific metrics i.e. ecto timings, process informations and so on.
Their configuration should be under `<collector_name>_collector`for erlang or `<Collector_name>Collector` for Elixir i.e. `process_collector`, `EctoCollector` and so on.
### Naming
For Erlang: `prometheus_<name>_collector`/`prometheus_<name>_exporter`.
For Elixir: `Prometheus.<name>Collector`/`Prometheus.<name>Exporter`.
## Contributing
Sections order:
`Types -> Macros -> Callbacks -> Public API -> Deprecations -> Private Parts`
install git precommit hook:
```
./bin/pre-commit.sh install
```
Pre-commit check can be skipped passing `--no-verify` option to git commit.
## License
MIT
## Modules ##
<table width="100%" border="0" summary="list of modules">
<tr><td><a href="https://github.com/deadtrickster/prometheus.erl/blob/master/doc/prometheus_boolean.md" class="module">prometheus_boolean</a></td></tr>
<tr><td><a href="https://github.com/deadtrickster/prometheus.erl/blob/master/doc/prometheus_buckets.md" class="module">prometheus_buckets</a></td></tr>
<tr><td><a href="https://github.com/deadtrickster/prometheus.erl/blob/master/doc/prometheus_collector.md" class="module">prometheus_collector</a></td></tr>
<tr><td><a href="https://github.com/deadtrickster/prometheus.erl/blob/master/doc/prometheus_counter.md" class="module">prometheus_counter</a></td></tr>
<tr><td><a href="https://github.com/deadtrickster/prometheus.erl/blob/master/doc/prometheus_format.md" class="module">prometheus_format</a></td></tr>
<tr><td><a href="https://github.com/deadtrickster/prometheus.erl/blob/master/doc/prometheus_gauge.md" class="module">prometheus_gauge</a></td></tr>
<tr><td><a href="https://github.com/deadtrickster/prometheus.erl/blob/master/doc/prometheus_histogram.md" class="module">prometheus_histogram</a></td></tr>
<tr><td><a href="https://github.com/deadtrickster/prometheus.erl/blob/master/doc/prometheus_http.md" class="module">prometheus_http</a></td></tr>
<tr><td><a href="https://github.com/deadtrickster/prometheus.erl/blob/master/doc/prometheus_mnesia.md" class="module">prometheus_mnesia</a></td></tr>
<tr><td><a href="https://github.com/deadtrickster/prometheus.erl/blob/master/doc/prometheus_mnesia_collector.md" class="module">prometheus_mnesia_collector</a></td></tr>
<tr><td><a href="https://github.com/deadtrickster/prometheus.erl/blob/master/doc/prometheus_model_helpers.md" class="module">prometheus_model_helpers</a></td></tr>
<tr><td><a href="https://github.com/deadtrickster/prometheus.erl/blob/master/doc/prometheus_protobuf_format.md" class="module">prometheus_protobuf_format</a></td></tr>
<tr><td><a href="https://github.com/deadtrickster/prometheus.erl/blob/master/doc/prometheus_registry.md" class="module">prometheus_registry</a></td></tr>
<tr><td><a href="https://github.com/deadtrickster/prometheus.erl/blob/master/doc/prometheus_summary.md" class="module">prometheus_summary</a></td></tr>
<tr><td><a href="https://github.com/deadtrickster/prometheus.erl/blob/master/doc/prometheus_text_format.md" class="module">prometheus_text_format</a></td></tr>
<tr><td><a href="https://github.com/deadtrickster/prometheus.erl/blob/master/doc/prometheus_time.md" class="module">prometheus_time</a></td></tr>
<tr><td><a href="https://github.com/deadtrickster/prometheus.erl/blob/master/doc/prometheus_vm_memory_collector.md" class="module">prometheus_vm_memory_collector</a></td></tr>
<tr><td><a href="https://github.com/deadtrickster/prometheus.erl/blob/master/doc/prometheus_vm_statistics_collector.md" class="module">prometheus_vm_statistics_collector</a></td></tr>
<tr><td><a href="https://github.com/deadtrickster/prometheus.erl/blob/master/doc/prometheus_vm_system_info_collector.md" class="module">prometheus_vm_system_info_collector</a></td></tr></table>